47
views
0
recommends
+1 Recommend
0 collections
    0
    shares
      • Record: found
      • Abstract: found
      • Article: found
      Is Open Access

      An evaluation of Chile’s Law of Food Labeling and Advertising on sugar-sweetened beverage purchases from 2015 to 2017: A before-and-after study

      research-article

      Read this article at

      Bookmark
          There is no author summary for this article yet. Authors can add summaries to their articles on ScienceOpen to make them more accessible to a non-specialist audience.

          Abstract

          Background

          Chile’s Law of Food Labeling and Advertising, implemented in 2016, was the first national regulation to jointly mandate front-of-package warning labels, restrict child-directed marketing, and ban sales in schools of all foods and beverages containing added sugars, sodium, or saturated fats that exceed set nutrient or calorie thresholds. The objective of this study is to evaluate the impact of this package of policies on household beverage purchases.

          Method and findings

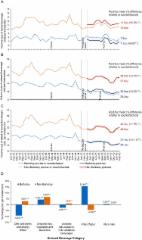
          In this observational study, monthly longitudinal data on packaged beverage purchases were collected from urban-dwelling households ( n = 2,383) participating in the Kantar WordPanel Chile Survey from January 1, 2015, to December 31, 2017. Beverage purchases were linked to nutritional information at the product level, reviewed by a team of nutritionists, and categorized as “high-in” or “not high-in” according to whether they contained high levels of nutrients of concern (i.e., sugars, sodium, saturated fat, or energy) according to Chilean nutrient thresholds and were thus subject to the law’s warning label, marketing restriction, and school sales ban policies. The majority of high-in beverages were categorized as such because of high sugar content. We used fixed-effects models to compare the observed volume as well as calorie and sugar content of postregulation beverage purchases to a counterfactual based on preregulation trends, overall and by household-head educational attainment. Of households included in the study, 37% of household heads had low education (less than high school), 40% had medium education (graduated high school), and 23% had high education (graduated college), with the sample becoming more educated over the study period. Compared to the counterfactual, the volume of high-in beverage purchases decreased 22.8 mL/capita/day, postregulation (95% confidence interval [CI] −22.9 to −22.7; p < 0.001), or 23.7% (95% CI −23.8% to −23.7%). High-educated and low-educated households showed similar absolute reductions in high-in beverage purchases (approximately 27 mL/capita/day; p < 0.001), but for high-educated households this amounted to a larger relative decline (−28.7%, 95% CI −28.8% to −28.6%) compared to low-educated households (−21.5%, 95% CI −21.6% to −21.4%), likely because of the high-educated households’ lower level of high-in beverage purchases in the preregulation period. Calories from high-in beverage purchases decreased 11.9 kcal/capita/day (95% CI −12.0 to −11.9; p < 0.001) or 27.5% (95% CI −27.6% to −27.5%). Calories purchased from beverages classified as “not high-in” increased 5.7 kcal/capita/day (95% CI 5.7–5.7; p < 0.001), or 10.8% (10.8%–10.8%). Calories from total beverage purchases decreased 7.4 kcal/capita/day (95% CI −7.4 to −7.3; p < 0.001), or 7.5% (95% CI −7.6% to −7.5%). A key limitation of this study is the inability to assess causality because of its observational nature. We also cannot determine whether observed changes in purchases are due to reformulation or consumer behavioral change, nor can we parse out the effects of the labeling, marketing, and school sales ban policies.

          Conclusions

          Purchases of high-in beverages significantly declined following implementation of Chile’s Law of Food Labeling and Advertising; these reductions were larger than those observed from single, standalone policies, including sugar-sweetened-beverage taxes previously implemented in Latin America. Future research should evaluate the effects of Chile’s policies on purchases of high-in foods, dietary intake, and long-term purchasing changes.

          Abstract

          Lindsey Smith Taillie et al. describe the changes in purchases of sugary beverages after implementation of Chile's law on food labeling and advertising, implemented to combat childhood obesity.

          Author summary

          Why was this study done?
          • In 2016, Chile implemented the Law of Food Labeling and Advertising, a set of policies designed to prevent further increases in obesity prevalence by subjecting foods and beverages high in energy, sugar, sodium, and saturated fat content to marketing restrictions, banned sales in schools, and the first national mandatory front-of-package (FOP) warning-label system.

          • Many countries are actively considering implementing similar policies, particularly the FOP warning-label policy.

          • Understanding how beverage purchases changed following implementation of this policy package can inform development of future obesity prevention policies.

          What did researchers do and find?
          • Using national data on household food purchases from before and after policy implementation, we examined changes in purchases of beverages high in sugar, saturated fat, sodium, or calories (i.e., “high-in” beverages). We compared observed beverage purchases after policy implementation to expected purchases had the policy not been implemented, based on preregulation trends.

          • We found that the purchase volume of high-in beverages decreased by 22.8 mL per capita per day or 23.7% after the regulation was implemented.

          • We also found that although high-educated households and low-educated households had similar absolute reductions in high-in beverage purchases, high-educated households had larger relative reductions in high-in beverage purchases.

          What do these findings mean?
          • After Chile’s labeling, marketing, and school food sales policies were implemented, purchases of high-in beverages decreased. This observed decrease is greater than purchase changes that have been observed following implementation of single, standalone policies in Latin America, such as a sugar-sweetened-beverage tax.

          • Future research will be needed to understand to what degree these changes are attributable to product reformulation of products and/or to changes in consumer behavior, as well as the impact of these regulations on dietary intake and health-related outcomes.

          Related collections

          Most cited references36

          • Record: found
          • Abstract: found
          • Article: found
          Is Open Access

          Interrupted time series regression for the evaluation of public health interventions: a tutorial

          Abstract Interrupted time series (ITS) analysis is a valuable study design for evaluating the effectiveness of population-level health interventions that have been implemented at a clearly defined point in time. It is increasingly being used to evaluate the effectiveness of interventions ranging from clinical therapy to national public health legislation. Whereas the design shares many properties of regression-based approaches in other epidemiological studies, there are a range of unique features of time series data that require additional methodological considerations. In this tutorial we use a worked example to demonstrate a robust approach to ITS analysis using segmented regression. We begin by describing the design and considering when ITS is an appropriate design choice. We then discuss the essential, yet often omitted, step of proposing the impact model a priori. Subsequently, we demonstrate the approach to statistical analysis including the main segmented regression model. Finally we describe the main methodological issues associated with ITS analysis: over-dispersion of time series data, autocorrelation, adjusting for seasonal trends and controlling for time-varying confounders, and we also outline some of the more complex design adaptations that can be used to strengthen the basic ITS design.
            Bookmark
            • Record: found
            • Abstract: found
            • Article: found
            Is Open Access

            Consumption of sugar sweetened beverages, artificially sweetened beverages, and fruit juice and incidence of type 2 diabetes: systematic review, meta-analysis, and estimation of population attributable fraction

            Objectives To examine the prospective associations between consumption of sugar sweetened beverages, artificially sweetened beverages, and fruit juice with type 2 diabetes before and after adjustment for adiposity, and to estimate the population attributable fraction for type 2 diabetes from consumption of sugar sweetened beverages in the United States and United Kingdom. Design Systematic review and meta-analysis. Data sources and eligibility PubMed, Embase, Ovid, and Web of Knowledge for prospective studies of adults without diabetes, published until February 2014. The population attributable fraction was estimated in national surveys in the USA, 2009-10 (n=4729 representing 189.1 million adults without diabetes) and the UK, 2008-12 (n=1932 representing 44.7 million). Synthesis methods Random effects meta-analysis and survey analysis for population attributable fraction associated with consumption of sugar sweetened beverages. Results Prespecified information was extracted from 17 cohorts (38 253 cases/10 126 754 person years). Higher consumption of sugar sweetened beverages was associated with a greater incidence of type 2 diabetes, by 18% per one serving/day (95% confidence interval 9% to 28%, I2 for heterogeneity=89%) and 13% (6% to 21%, I2=79%) before and after adjustment for adiposity; for artificially sweetened beverages, 25% (18% to 33%, I2=70%) and 8% (2% to 15%, I2=64%); and for fruit juice, 5% (−1% to 11%, I2=58%) and 7% (1% to 14%, I2=51%). Potential sources of heterogeneity or bias were not evident for sugar sweetened beverages. For artificially sweetened beverages, publication bias and residual confounding were indicated. For fruit juice the finding was non-significant in studies ascertaining type 2 diabetes objectively (P for heterogeneity=0.008). Under specified assumptions for population attributable fraction, of 20.9 million events of type 2 diabetes predicted to occur over 10 years in the USA (absolute event rate 11.0%), 1.8 million would be attributable to consumption of sugar sweetened beverages (population attributable fraction 8.7%, 95% confidence interval 3.9% to 12.9%); and of 2.6 million events in the UK (absolute event rate 5.8%), 79 000 would be attributable to consumption of sugar sweetened beverages (population attributable fraction 3.6%, 1.7% to 5.6%). Conclusions Habitual consumption of sugar sweetened beverages was associated with a greater incidence of type 2 diabetes, independently of adiposity. Although artificially sweetened beverages and fruit juice also showd positive associations with incidence of type 2 diabetes, the findings were likely to involve bias. None the less, both artificially sweetened beverages and fruit juice were unlikely to be healthy alternatives to sugar sweetened beverages for the prevention of type 2 diabetes. Under assumption of causality, consumption of sugar sweetened beverages over years may be related to a substantial number of cases of new onset diabetes.
              Bookmark
              • Record: found
              • Abstract: found
              • Article: found
              Is Open Access

              Changes in prices, sales, consumer spending, and beverage consumption one year after a tax on sugar-sweetened beverages in Berkeley, California, US: A before-and-after study

              Background Taxes on sugar-sweetened beverages (SSBs) meant to improve health and raise revenue are being adopted, yet evaluation is scarce. This study examines the association of the first penny per ounce SSB excise tax in the United States, in Berkeley, California, with beverage prices, sales, store revenue/consumer spending, and usual beverage intake. Methods and findings Methods included comparison of pre-taxation (before 1 January 2015) and first-year post-taxation (1 March 2015–29 February 2016) measures of (1) beverage prices at 26 Berkeley stores; (2) point-of-sale scanner data on 15.5 million checkouts for beverage prices, sales, and store revenue for two supermarket chains covering three Berkeley and six control non-Berkeley large supermarkets in adjacent cities; and (3) a representative telephone survey (17.4% cooperation rate) of 957 adult Berkeley residents. Key hypotheses were that (1) the tax would be passed through to the prices of taxed beverages among the chain stores in which Berkeley implemented the tax in 2015; (2) sales of taxed beverages would decline, and sales of untaxed beverages would rise, in Berkeley stores more than in comparison non-Berkeley stores; (3) consumer spending per transaction (checkout episode) would not increase in Berkeley stores; and (4) self-reported consumption of taxed beverages would decline. Main outcomes and measures included changes in inflation-adjusted prices (cents/ounce), beverage sales (ounces), consumers’ spending measured as store revenue (inflation-adjusted dollars per transaction) in two large chains, and usual beverage intake (grams/day and kilocalories/day). Tax pass-through (changes in the price after imposition of the tax) for SSBs varied in degree and timing by store type and beverage type. Pass-through was complete in large chain supermarkets (+1.07¢/oz, p = 0.001) and small chain supermarkets and chain gas stations (1.31¢/oz, p = 0.004), partial in pharmacies (+0.45¢/oz, p = 0.03), and negative in independent corner stores and independent gas stations (−0.64¢/oz, p = 0.004). Sales-unweighted mean price change from scanner data was +0.67¢/oz (p = 0.00) (sales-weighted, +0.65¢/oz, p = 0.003), with +1.09¢/oz (p < 0.001) for sodas and energy drinks, but a lower change in other categories. Post-tax year 1 scanner data SSB sales (ounces/transaction) in Berkeley stores declined 9.6% (p < 0.001) compared to estimates if the tax were not in place, but rose 6.9% (p < 0.001) for non-Berkeley stores. Sales of untaxed beverages in Berkeley stores rose by 3.5% versus 0.5% (both p < 0.001) for non-Berkeley stores. Overall beverage sales also rose across stores. In Berkeley, sales of water rose by 15.6% (p < 0.001) (exceeding the decline in SSB sales in ounces); untaxed fruit, vegetable, and tea drinks, by 4.37% (p < 0.001); and plain milk, by 0.63% (p = 0.01). Scanner data mean store revenue/consumer spending (dollars per transaction) fell 18¢ less in Berkeley (−$0.36, p < 0.001) than in comparison stores (−$0.54, p < 0.001). Baseline and post-tax Berkeley SSB sales and usual dietary intake were markedly low compared to national levels (at baseline, National Health and Nutrition Examination Survey SSB intake nationally was 131 kcal/d and in Berkeley was 45 kcal/d). Reductions in self-reported mean daily SSB intake in grams (−19.8%, p = 0.49) and in mean per capita SSB caloric intake (−13.3%, p = 0.56) from baseline to post-tax were not statistically significant. Limitations of the study include inability to establish causal links due to observational design, and the absence of health outcomes. Analysis of consumption was limited by the small effect size in relation to high standard error and Berkeley’s low baseline consumption. Conclusions One year following implementation of the nation’s first large SSB tax, prices of SSBs increased in many, but not all, settings, SSB sales declined, and sales of untaxed beverages (especially water) and overall study beverages rose in Berkeley; overall consumer spending per transaction in the stores studied did not rise. Price increases for SSBs in two distinct data sources, their timing, and the patterns of change in taxed and untaxed beverage sales suggest that the observed changes may be attributable to the tax. Post-tax self-reported SSB intake did not change significantly compared to baseline. Significant declines in SSB sales, even in this relatively affluent community, accompanied by revenue used for prevention suggest promise for this policy. Evaluation of taxation in jurisdictions with more typical SSB consumption, with controls, is needed to assess broader dietary and potential health impacts.
                Bookmark

                Author and article information

                Contributors
                Role: ConceptualizationRole: Data curationRole: Formal analysisRole: Funding acquisitionRole: InvestigationRole: MethodologyRole: Project administrationRole: Writing – original draftRole: Writing – review & editing
                Role: ConceptualizationRole: MethodologyRole: Project administrationRole: ResourcesRole: SupervisionRole: Writing – review & editing
                Role: Formal analysisRole: InvestigationRole: MethodologyRole: Writing – review & editing
                Role: ConceptualizationRole: Funding acquisitionRole: MethodologyRole: Project administrationRole: Writing – review & editing
                Role: ConceptualizationRole: Funding acquisitionRole: MethodologyRole: Project administrationRole: Writing – review & editing
                Role: Academic Editor
                Journal
                PLoS Med
                PLoS Med
                plos
                plosmed
                PLoS Medicine
                Public Library of Science (San Francisco, CA USA )
                1549-1277
                1549-1676
                11 February 2020
                February 2020
                : 17
                : 2
                : e1003015
                Affiliations
                [1 ] Carolina Population Center, University of North Carolina at Chapel Hill, Chapel Hill, North Carolina, United States of America
                [2 ] Department of Nutrition, Gillings School of Global Public Health, University of North Carolina at Chapel Hill, Chapel Hill, North Carolina, United States of America
                [3 ] Institute of Nutrition and Food Technology, University of Chile, Santiago, Chile
                [4 ] Instituto Nacional de Salud Pública, Cuernavaca, Morelos, Mexico
                Harvard Medical School, UNITED STATES
                Author notes

                We have read and understood PLOS Medicine’s policy on declaration of interests and LST, MR, CC, and AC declare that they have no competing interests. BP is on the editorial board and otherwise has no competing interests.

                Author information
                http://orcid.org/0000-0002-4555-2525
                http://orcid.org/0000-0002-4891-7120
                http://orcid.org/0000-0001-9495-9324
                Article
                PMEDICINE-D-19-01988
                10.1371/journal.pmed.1003015
                7012389
                32045424
                f5c72f74-330e-4f91-bbae-95f22ddceab4
                © 2020 Taillie et al

                This is an open access article distributed under the terms of the Creative Commons Attribution License, which permits unrestricted use, distribution, and reproduction in any medium, provided the original author and source are credited.

                History
                : 3 June 2019
                : 7 January 2020
                Page count
                Figures: 3, Tables: 2, Pages: 22
                Funding
                Funded by: Bloomberg Philanthropies
                Funded by: International Development Research Center
                Award ID: 108180 and 107731
                Funding support comes from Bloomberg Philanthropies ( https://www.bloomberg.org/; received by BP) and the International Development Research Center (Grants 108180 and 107731; https://www.idrc.ca/; received by CC).This research also received support from the Population Research Infrastructure Program awarded to the Carolina Population Center (P2C HD050924) at The University of North Carolina at Chapel Hill by the Eunice Kennedy Shriver National Institute of Child Health and Human Development. The funders had no role in study design, data collection and analysis, decision to publish, or preparation of the manuscript.
                Categories
                Research Article
                Biology and Life Sciences
                Nutrition
                Diet
                Beverages
                Medicine and Health Sciences
                Nutrition
                Diet
                Beverages
                Social Sciences
                Law and Legal Sciences
                Regulations
                Social Sciences
                Sociology
                Education
                Schools
                Social Sciences
                Sociology
                Communications
                Marketing
                Social Sciences
                Sociology
                Communications
                Marketing
                Advertising
                People and places
                Geographical locations
                South America
                Chile (Country)
                Social Sciences
                Political Science
                Public Policy
                Taxes
                Biology and Life Sciences
                Biochemistry
                Lipids
                Fats
                Custom metadata
                Data are from Kantar WorldPanel Chile ( http://www.kantarworldpanel.com/cl). The authors are not legally permitted to share the data used for this study, but interested parties may contact Kantar WorldPanel representative Maria Paz Roman to inquire about accessing this proprietary data ( mariapaz.roman@ 123456kantarworldpanel.com ). No accession number is needed when requesting data.

                Medicine
                Medicine

                Comments

                Comment on this article