40
views
0
recommends
+1 Recommend
0 collections
    0
    shares
      • Record: found
      • Abstract: found
      • Article: found
      Is Open Access

      Evaluating the 2014 sugar-sweetened beverage tax in Chile: An observational study in urban areas

      research-article

      Read this article at

      Bookmark
          There is no author summary for this article yet. Authors can add summaries to their articles on ScienceOpen to make them more accessible to a non-specialist audience.

          Abstract

          Background

          In October 2014, Chile implemented a tax modification on sugar-sweetened beverages (SSBs) called the Impuesto Adicional a las Bebidas Analcohólicas (IABA). The design of the tax was unique, increasing the tax on soft drinks above 6.25 grams of added sugar per 100 mL and decreasing the tax for those below this threshold.

          Methods and findings

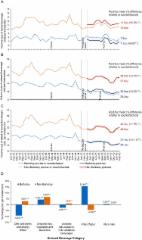
          This study evaluates Chile’s SSB tax, which was announced in March 2014 and implemented in October 2014. We used household-level grocery-purchasing data from 2011 to 2015 for 2,836 households living in cities representative of the urban population of Chile. We employed a fixed-effects econometric approach and estimated the before–after change in purchasing of SSBs controlling for seasonality, general time trend, temperature, and economic fluctuations as well as time-invariant household characteristics. Results showed significant changes in purchasing for the statistically preferred model: while there was a barely significant decrease in the volume of all soft drinks, there was a highly significant decrease in the monthly purchased volume of the higher-taxed, sugary soft drinks by 21.6%. The direction of this reduction was robust to different empirical modelling approaches, but the statistical significance and the magnitude of the changes varied considerably. The reduction in soft drink purchasing was most evident amongst higher socioeconomic groups and higher pretax purchasers of sugary soft drinks. There was no systematic, robust pattern in the estimates by household obesity status. After tax implementation, the purchase prices of soft drinks decreased for the items for which the tax rate was reduced, but they remained unchanged for sugary items, for which the tax was increased. However, the purchase prices increased for sugary soft drinks at the time of the policy announcement. The main limitations include a lack of a randomised design, limiting the extent of causal inference possible, and the focus on purchasing data rather than consumption or health outcomes.

          Conclusions

          The results of subgroup analyses suggest that the policy may have been partially effective, though not necessarily in ways that are likely to reduce socioeconomic inequalities in diet-related health. It remains unclear whether the policy has had a major, overall population-level impact. Additionally, because the present study examined purchasing of soft drinks for only 1 year, a longer-term evaluation—ideally including an assessment of consumption and health impacts—should be conducted in future research.

          Trial registration

          ClinicalTrials.gov Identifier: NCT02926001

          Abstract

          Ryota Nakamura and colleagues present findings from an observational study of sugar-sweetened beverage purchases in Chile after a tax change.

          Author summary

          Why was this study done?
          • Chile and other countries in the world are facing a major challenge to curb rising rates of obesity and diet-related ill health, often particularly among lower socioeconomic groups.

          • Fiscal policy has the potential to influence consumption patterns towards healthier options (and raise government revenue for welfare-enhancing purposes), thereby contributing to the prevention of chronic diseases and to the reduction of the associated economic costs.

          • Most existing evidence on the effects of fiscal incentives to promote diet-related health relies on small-scale experiments or hypothetical simulations using price elasticity estimated from observational data, largely suggesting that increasing the price of products such as sugar-sweetened beverages (SSBs) would reduce purchasing or consumption. There is, however, a scarcity of empirical evaluations of actual diet-related fiscal interventions, and it is still uncertain whether these can be effective in improving population diet and health in a ‘real world’ context.

          What did the researchers do and find?
          • This study evaluates the tax policy applied to SSBs in Chile. The ‘Impuesto Adicional a las Bebidas Analcohólicas’ (IABA; or ‘additional tax on nonalcoholic drinks’), which was announced in March 2014 and implemented in October 2014. The IABA policy targeted any nonalcoholic beverages to which colorants, flavourings, or sweeteners have been added. For beverages with an added sugar concentration of 6.25 grams per 100 mL (or equivalent proportion) or more, the tax was increased from 13% to 18%, while for those below this threshold, the tax was decreased from 13% to 10%, producing an 8% tax difference.

          • We applied a series of econometric approaches to evaluate the effects of the announcement and implementation of the tax policy, using household-level grocery-purchasing data from Chile for 3 years pre- and 1 year post-tax implementation.

          • We find that, despite the fact that the tax incentive is comparatively small, there are signs that purchasing of SSBs with higher sugar content has been reduced among high socioeconomic groups of the population.

          What do these findings mean?
          • The results suggest that the Chilean tax policy may have been partially effective, though not necessarily in ways that are likely to reduce socioeconomic inequalities in diet-related health.

          • Longer-term evaluations are needed to analyse the effect on SSB purchasing in the long run as well as on health outcomes.

          • The evaluation did not involve a randomised design, therefore the degree to which we can interpret the results as truly causal will be limited.

          Related collections

          Most cited references21

          • Record: found
          • Abstract: found
          • Article: not found

          Understanding differences in health behaviors by education.

          Using a variety of data sets from two countries, we examine possible explanations for the relationship between education and health behaviors, known as the education gradient. We show that income, health insurance, and family background can account for about 30 percent of the gradient. Knowledge and measures of cognitive ability explain an additional 30 percent. Social networks account for another 10 percent. Our proxies for discounting, risk aversion, or the value of future do not account for any of the education gradient, and neither do personality factors such as a sense of control of oneself or over one's life. Copyright 2009 Elsevier B.V. All rights reserved.
            Bookmark
            • Record: found
            • Abstract: found
            • Article: found
            Is Open Access

            Changes in prices, sales, consumer spending, and beverage consumption one year after a tax on sugar-sweetened beverages in Berkeley, California, US: A before-and-after study

            Background Taxes on sugar-sweetened beverages (SSBs) meant to improve health and raise revenue are being adopted, yet evaluation is scarce. This study examines the association of the first penny per ounce SSB excise tax in the United States, in Berkeley, California, with beverage prices, sales, store revenue/consumer spending, and usual beverage intake. Methods and findings Methods included comparison of pre-taxation (before 1 January 2015) and first-year post-taxation (1 March 2015–29 February 2016) measures of (1) beverage prices at 26 Berkeley stores; (2) point-of-sale scanner data on 15.5 million checkouts for beverage prices, sales, and store revenue for two supermarket chains covering three Berkeley and six control non-Berkeley large supermarkets in adjacent cities; and (3) a representative telephone survey (17.4% cooperation rate) of 957 adult Berkeley residents. Key hypotheses were that (1) the tax would be passed through to the prices of taxed beverages among the chain stores in which Berkeley implemented the tax in 2015; (2) sales of taxed beverages would decline, and sales of untaxed beverages would rise, in Berkeley stores more than in comparison non-Berkeley stores; (3) consumer spending per transaction (checkout episode) would not increase in Berkeley stores; and (4) self-reported consumption of taxed beverages would decline. Main outcomes and measures included changes in inflation-adjusted prices (cents/ounce), beverage sales (ounces), consumers’ spending measured as store revenue (inflation-adjusted dollars per transaction) in two large chains, and usual beverage intake (grams/day and kilocalories/day). Tax pass-through (changes in the price after imposition of the tax) for SSBs varied in degree and timing by store type and beverage type. Pass-through was complete in large chain supermarkets (+1.07¢/oz, p = 0.001) and small chain supermarkets and chain gas stations (1.31¢/oz, p = 0.004), partial in pharmacies (+0.45¢/oz, p = 0.03), and negative in independent corner stores and independent gas stations (−0.64¢/oz, p = 0.004). Sales-unweighted mean price change from scanner data was +0.67¢/oz (p = 0.00) (sales-weighted, +0.65¢/oz, p = 0.003), with +1.09¢/oz (p < 0.001) for sodas and energy drinks, but a lower change in other categories. Post-tax year 1 scanner data SSB sales (ounces/transaction) in Berkeley stores declined 9.6% (p < 0.001) compared to estimates if the tax were not in place, but rose 6.9% (p < 0.001) for non-Berkeley stores. Sales of untaxed beverages in Berkeley stores rose by 3.5% versus 0.5% (both p < 0.001) for non-Berkeley stores. Overall beverage sales also rose across stores. In Berkeley, sales of water rose by 15.6% (p < 0.001) (exceeding the decline in SSB sales in ounces); untaxed fruit, vegetable, and tea drinks, by 4.37% (p < 0.001); and plain milk, by 0.63% (p = 0.01). Scanner data mean store revenue/consumer spending (dollars per transaction) fell 18¢ less in Berkeley (−$0.36, p < 0.001) than in comparison stores (−$0.54, p < 0.001). Baseline and post-tax Berkeley SSB sales and usual dietary intake were markedly low compared to national levels (at baseline, National Health and Nutrition Examination Survey SSB intake nationally was 131 kcal/d and in Berkeley was 45 kcal/d). Reductions in self-reported mean daily SSB intake in grams (−19.8%, p = 0.49) and in mean per capita SSB caloric intake (−13.3%, p = 0.56) from baseline to post-tax were not statistically significant. Limitations of the study include inability to establish causal links due to observational design, and the absence of health outcomes. Analysis of consumption was limited by the small effect size in relation to high standard error and Berkeley’s low baseline consumption. Conclusions One year following implementation of the nation’s first large SSB tax, prices of SSBs increased in many, but not all, settings, SSB sales declined, and sales of untaxed beverages (especially water) and overall study beverages rose in Berkeley; overall consumer spending per transaction in the stores studied did not rise. Price increases for SSBs in two distinct data sources, their timing, and the patterns of change in taxed and untaxed beverage sales suggest that the observed changes may be attributable to the tax. Post-tax self-reported SSB intake did not change significantly compared to baseline. Significant declines in SSB sales, even in this relatively affluent community, accompanied by revenue used for prevention suggest promise for this policy. Evaluation of taxation in jurisdictions with more typical SSB consumption, with controls, is needed to assess broader dietary and potential health impacts.
              Bookmark
              • Record: found
              • Abstract: found
              • Article: found
              Is Open Access

              The effect of rising food prices on food consumption: systematic review with meta-regression

              Objective To quantify the relation between food prices and the demand for food with specific reference to national and household income levels. Design Systematic review with meta-regression. Data sources Online databases of peer reviewed and grey literature (ISI Web of Science, EconLit, PubMed, Medline, AgEcon, Agricola, Google, Google Scholar, IdeasREPEC, Eldis, USAID, United Nations Food and Agriculture Organization, World Bank, International Food Policy Research Institute), hand searched reference lists, and contact with authors. Study selection We included cross sectional, cohort, experimental, and quasi-experimental studies with English abstracts. Eligible studies used nationally representative data from 1990 onwards derived from national aggregate data sources, household surveys, or supermarket and home scanners. Data analysis The primary outcome extracted from relevant papers was the quantification of the demand for foods in response to changes in food price (own price food elasticities). Descriptive and study design variables were extracted for use as covariates in analysis. We conducted meta-regressions to assess the effect of income levels between and within countries on the strength of the relation between food price and demand, and predicted price elasticities adjusted for differences across studies. Results 136 studies reporting 3495 own price food elasticities from 162 different countries were identified. Our models predict that increases in the price of all foods result in greater reductions in food consumption in poor countries: in low and high income countries, respectively, a 1% increase in the price of cereals results in reductions in consumption of 0.61% (95% confidence interval 0.56% to 0.66%) and 0.43% (0.36% to 0.48%), and a 1% increase in the price of meat results in reductions in consumption of 0.78% (0.73% to 0.83%) and 0.60% (0.54% to 0.66%). Within all countries, our models predict that poorer households will be the most adversely affected by increases in food prices. Conclusions Changes in global food prices will have a greater effect on food consumption in lower income countries and in poorer households within countries. This has important implications for national responses to increases in food prices and for the definition of policies designed to reduce the global burden of undernutrition.
                Bookmark

                Author and article information

                Contributors
                Role: ConceptualizationRole: Formal analysisRole: Funding acquisitionRole: InvestigationRole: MethodologyRole: Writing – original draft
                Role: ConceptualizationRole: Formal analysisRole: Funding acquisitionRole: InvestigationRole: MethodologyRole: Writing – original draft
                Role: ConceptualizationRole: Formal analysisRole: Funding acquisitionRole: InvestigationRole: MethodologyRole: Project administrationRole: Writing – review & editing
                Role: ConceptualizationRole: Formal analysisRole: Funding acquisitionRole: InvestigationRole: MethodologyRole: Writing – review & editing
                Role: Formal analysisRole: InvestigationRole: Writing – review & editing
                Role: ConceptualizationRole: Funding acquisitionRole: InvestigationRole: MethodologyRole: Project administrationRole: Writing – original draft
                Role: Academic Editor
                Journal
                PLoS Med
                PLoS Med
                plos
                plosmed
                PLoS Medicine
                Public Library of Science (San Francisco, CA USA )
                1549-1277
                1549-1676
                3 July 2018
                July 2018
                : 15
                : 7
                : e1002596
                Affiliations
                [1 ] Centre for Health Economics, University of York, York, United Kingdom
                [2 ] Hitotsubashi Institute for Advanced Study, Hitotsubashi University, Tokyo, Japan
                [3 ] School of Public Health, University of Chile, Santiago, Chile
                [4 ] ICBM, Faculty of Medicine, University of Chile, Santiago, Chile
                [5 ] Luxembourg Institute for Socio-economic Research, Esch-sur-Alzette, Luxembourg
                University of Cambridge, UNITED KINGDOM
                Author notes

                The authors have declared that no competing interests exist.

                Author information
                http://orcid.org/0000-0002-3217-6452
                http://orcid.org/0000-0002-7622-0937
                http://orcid.org/0000-0002-0174-5958
                http://orcid.org/0000-0001-6726-7242
                Article
                PMEDICINE-D-17-03819
                10.1371/journal.pmed.1002596
                6029775
                29969456
                68a49d68-e176-4076-af9a-ae5ce3099f00
                © 2018 Nakamura et al

                This is an open access article distributed under the terms of the Creative Commons Attribution License, which permits unrestricted use, distribution, and reproduction in any medium, provided the original author and source are credited.

                History
                : 23 October 2017
                : 29 May 2018
                Page count
                Figures: 1, Tables: 3, Pages: 22
                Funding
                Funded by: funder-id http://dx.doi.org/10.13039/501100000265, Medical Research Council;
                Award ID: MR/N026640/1
                Award Recipient :
                Funded by: funder-id http://dx.doi.org/10.13039/501100002848, Comisión Nacional de Investigación Científica y Tecnológica;
                Award ID: MR/N026640/1
                Award Recipient :
                The submitted work was financially supported by the Research Council UK ( https://www.mrc.ac.uk/) and Comisión Nacional de Investigación Científica y Tecnológica of Chile ( http://www.conicyt.cl/) under grant MR/N026640/1. The funders had no role in study design, data collection and analysis, decision to publish, or preparation of the manuscript.
                Categories
                Research Article
                Social Sciences
                Political Science
                Public Policy
                Taxes
                Biology and Life Sciences
                Nutrition
                Diet
                Beverages
                Medicine and Health Sciences
                Nutrition
                Diet
                Beverages
                People and places
                Geographical locations
                South America
                Chile (Country)
                Medicine and Health Sciences
                Health Care
                Socioeconomic Aspects of Health
                Medicine and Health Sciences
                Public and Occupational Health
                Socioeconomic Aspects of Health
                Medicine and Health Sciences
                Health Care
                Health Care Policy
                Biology and Life Sciences
                Physiology
                Physiological Parameters
                Body Weight
                Body Mass Index
                Medicine and Health Sciences
                Physiology
                Physiological Parameters
                Body Weight
                Body Mass Index
                Physical Sciences
                Mathematics
                Algebra
                Polynomials
                Research and Analysis Methods
                Mathematical and Statistical Techniques
                Statistical Methods
                Regression Analysis
                Physical Sciences
                Mathematics
                Statistics (Mathematics)
                Statistical Methods
                Regression Analysis
                Custom metadata
                The data are household-level food-purchasing data collected by Kantar WorldPanel Chile for the time period January 2011 to December 2015. By contract, the authors are not allowed to share the data with any third party, but the owner of the data may be contacted at Kantar WorldPanel Chile, Santiago Office.

                Medicine
                Medicine

                Comments

                Comment on this article