- Record: found
- Abstract: not found
- Article: not found
Transmission dynamics of Ebola virus disease and intervention effectiveness in Sierra Leone
Author(s):
Li-Qun Fang ,
Yang Yang ,
Jia-Fu Jiang ,
Hong-Wu Yao ,
David Kargbo ,
Xin-Lou Li ,
Bao-Gui Jiang ,
Brima Kargbo ,
Yi-Gang Tong ,
Ya-Wei Wang ,
Kun Liu ,
Abdul Kamara ,
Foday Dafae ,
Alex Kanu ,
Rui-Ruo Jiang ,
Ye Sun ,
Ruo-Xi Sun ,
Wan-Jun Chen ,
Mai-Juan Ma ,
Natalie E. Dean ,
Harold Thomas ,
Ira M. Longini ,
M. Elizabeth Halloran ,
Wu-Chun Cao
Publication date Created:
April 19 2016
Publication date (Electronic):
March 28 2016
Read this article at

There is no author summary for this article yet. Authors can add summaries to their articles on ScienceOpen to make them more accessible to a non-specialist audience.
Abstract
Sierra Leone is the most severely affected country by an unprecedented outbreak of
Ebola virus disease (EVD) in West Africa. Although successfully contained, the transmission
dynamics of EVD and the impact of interventions in the country remain unclear. We
established a database of confirmed and suspected EVD cases from May 2014 to September
2015 in Sierra Leone and mapped the spatiotemporal distribution of cases at the chiefdom
level. A Poisson transmission model revealed that the transmissibility at the chiefdom
level, estimated as the average number of secondary infections caused by a patient
per week, was reduced by 43% [95% confidence interval (CI): 30%, 52%] after October
2014, when the strategic plan of the United Nations Mission for Emergency Ebola Response
was initiated, and by 65% (95% CI: 57%, 71%) after the end of December 2014, when
100% case isolation and safe burials were essentially achieved, both compared with
before October 2014. Population density, proximity to Ebola treatment centers, cropland
coverage, and atmospheric temperature were associated with EVD transmission. The household
secondary attack rate (SAR) was estimated to be 0.059 (95% CI: 0.050, 0.070) for the
overall outbreak. The household SAR was reduced by 82%, from 0.093 to 0.017, after
the nationwide campaign to achieve 100% case isolation and safe burials had been conducted.
This study provides a complete overview of the transmission dynamics of the 2014-2015
EVD outbreak in Sierra Leone at both chiefdom and household levels. The interventions
implemented in Sierra Leone seem effective in containing the epidemic, particularly
in interrupting household transmission.
Related collections
Most cited references13

- Record: found
- Abstract: found
- Article: found
Characterization of Regional Influenza Seasonality Patterns in China and Implications for Vaccination Strategies: Spatio-Temporal Modeling of Surveillance Data
Hongjie Yu, Wladimir J Alonso, Luzhao Feng … (2013)
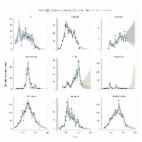
Introduction The seasonality of influenza has been well studied in temperate regions of the world but remains poorly characterized in tropical and subtropical areas [1],[2]. A growing body of evidence suggests that seasonal patterns are highly diverse in tropical settings, particularly in Asia, where influenza can display semi-annual or annual epidemic cycles, as well as year-round activity [2]–[4]. Experimental and modeling studies have suggested that low levels of absolute humidity and cold temperature favor influenza transmission and survival in temperate settings [5]–[8], while rainfall fluctuations may drive influenza activity in low latitudes [8]. From a public health perspective, local information on influenza seasonality and circulating strains is crucial to inform the timing and composition of influenza vaccines, particularly for large tropical countries [9]. In parallel, there is growing interest in establishing routine immunization programs in low- and middle-income regions [10], due to strengthening of laboratory surveillance systems and increased recognition of disease burden [11]–[14]. China is a geographically, economically, and climatologically diverse country with a population of 1.34 billion, which experiences substantial influenza mortality burden, estimated at 11–18 excess deaths per 100,000 in pandemic and inter-pandemic seasons [11],[15]. Although seasonal influenza vaccination was introduced in 1998, China has yet to initiate a national immunization program [16]. Previous work has suggested intriguing differences in the seasonality and evolutionary dynamics of influenza between Northern and Southern China [4],[17],[18], indicating that analysis of high-resolution epidemiological data will be required to guide control strategies in this country. The goals of our study were to characterize the seasonality of the disease across China, assess the role of putative drivers of seasonality, and identify broad epidemiological regions that could be used as a basis to optimize the timing of future vaccination programs. Methods Influenza Surveillance Dataset We used weekly reports from a national sentinel hospital-based influenza surveillance network, providing the number of laboratory-confirmed influenza cases by virus type (influenza A and B) and the number of specimens tested in 30 Chinese provinces. Influenza laboratory surveillance was initiated in 2000 in China; here we focused on the period 2005–2011 where sampling was more intense. We briefly describe the surveillance system below; refer to [11] for more details. Each week, 193 sentinel hospitals located in 88 cities representing all 30 provinces with exception of Tibet (Figure 1) reported the number of patients with influenza-like-illness (ILI) and total visits to outpatient and/or emergency departments to a centralized online system maintained by Chinese Center for Disease Control and Prevention (China CDC, Beijing). Identification of patients with ILI was based on a standard case definition, including body temperature ≥38°C with either cough or sore throat, in the absence of an alternative diagnosis. In each sentinel hospital, nasopharyngeal swabs were collected daily from the first one or two ILI cases and placed in sterile viral transport medium for influenza virus testing, resulting in ten to 15 specimens per hospital per surveillance week. Samples were inoculated into Madin-Darby canine kidney (MDCK) cells and/or specific pathogen free (SPF) chicken embryo for virus isolation. Hemagglutination inhibition (HI) and/or conventional or real-time reverse transcription PCR (RT-PCR) assay were performed to identify the types/subtype of influenza virus, following a standard protocol [19]. 10.1371/journal.pmed.1001552.g001 Figure 1 Map of Chinese provinces conducting influenza surveillance (n = 30). Dots indicate the location of the capital city in each province. A total of 193 hospitals participate in disease surveillance, representing 88 cities. Colors illustrate different climatic domains (black, cold-temperate; blue, mid-temperate; green, warm-temperate; orange, subtropical; red, tropical). Different symbols indicate the type of surveillance scheme (circles, year-round surveillance; triangles, Oct through Mar surveillance). Because of limited understanding of the seasonality of influenza in China prior to this study, and following general WHO recommendations, influenza surveillance was implemented year-round in 99 Southern Chinese hospitals, representing 45 cities below latitude 34°N. To confirm the seasonality of influenza in Northern China, surveillance activities were also conducted year-round in 22 of the 94 northern hospitals, while surveillance was restricted to the period October to March in the remaining hospitals (representing 43 cities total; Figure 1). In response to the evolving A/H1N1 pandemic, all 193 sentinel hospitals were asked to implement surveillance year-round starting in May 2009. All 193 participating hospitals have contributed systematic information during the study period, so that the number of participating sites remained constant. Since China is located in the Northern Hemisphere, we defined the respiratory season as the period running from August 1st to July 31st each year. Analysis excluded the A/H1N1 pandemic season April 2009–April 2010 to focus on influenza patterns in inter-pandemic seasons. Climate, Geographic, and Demographic Data To assess the role of putative drivers of influenza seasonality, we collected province-level demographic, economic, and geographic data, including population size and density [20], gross domestic product [20], and human mobility patterns between provinces (including the per capita number of passengers travelling by air, rail, road, and boat [21]). Average latitude and longitude coordinates for each province were obtained by weighting the coordinates of cities participating in influenza surveillance by their population sizes (Table 1). 10.1371/journal.pmed.1001552.t001 Table 1 Background characteristics of the 30 provinces involved in influenza surveillance and information on influenza sampling intensity, 2005–2011, China. Province (Climate) n Cities (Hosp)a Population Size (M) Latitude (°N) Longitude (°E) Per Capita GRP (2009) $ Per Capita Annual Passenger Fluxes Mean Monthly Temperature (Min, Max) °C Mean Monthly Air Pressure (Min, Max) Bar Mean Monthly Relative Humidity (Min, Max) % Mean Monthly Rainfall (Min, Max) mm Mean Monthly Hours Sunshine (Min, Max) Mean Annual n Specimens Tested (rate per 10,000) Mean Annual n Influenza Positive Anhuib (ST) 2 (5) 5.9 31.8 117.5 2,402 219.5 17 (3, 29) 1.01 (1, 1.02) 74 (68, 83) 32 (30, 37) 11 (4, 20) 2,273 (38.6) 360 Beijing (WT) 1 (5) 16.1 39.9 116.4 10,313 77.7 13 (−2, 27) 1.01 (1, 1.02) 53 (39, 70) 23 (17, 32) 4 (0, 9) 2,122 (13.2) 485 Chongqingb (ST) 1 (5) 13.8 29.6 106.6 3,355 77.2 19 (8, 29) 0.98 (0.97, 0.99) 79 (73, 86) 34 (32, 38) 12 (3, 22) 1,892 (13.7) 436 Fujianb (ST) 4 (9) 19.9 25.3 118.8 4,954 36.1 21 (11, 29) 1 (0.99, 1.01) 73 (65, 80) 32 (29, 34) 15 (3, 29) 4,231 (21.3) 701 Gansub (MT) 3 (6) 8.4 35.6 104.7 1,884 54.4 9 (−6, 22) 0.84 (0.83, 0.84) 59 (47, 71) 26 (21, 31) 3 (0, 6) 2,213 (26.2) 389 Guangdongb (ST) 3 (9) 21.1 22.9 113.4 6,026 224.8 23 (14, 29) 1.01 (1, 1.02) 73 (64, 79) 32 (28, 34) 17 (4, 39) 5,671 (26.8) 772 Guangxib (ST) 1 (4) 6.6 22.9 108.4 2,349 96.2 22 (12, 28) 1 (0.99, 1.01) 79 (74, 83) 34 (32, 37) 12 (5, 27) 2,082 (31.5) 245 Guizhoub (ST) 2 (5) 10.9 27.4 106.8 1,509 37.5 15 (4, 24) 0.9 (0.89, 0.9) 76 (73, 80) 33 (31, 36) 11 (4, 21) 1,920 (17.7) 179 Hainanb (T) 5 (6) 4.1 19.6 110.1 2,818 93.5 25 (18, 29) 1 (1, 1.01) 79 (76, 82) 34 (32, 36) 16 (2, 36) 1,860 (45.9) 240 Hebei (WT) 4 (10) 33.7 38.1 115.8 3,598 21.7 14 (−2, 27) 1.01 (1, 1.02) 59 (45, 74) 26 (20, 33) 4 (0, 10) 1,899 (5.6) 344 Heilongjiang (MT) 3 (7) 18.6 46.1 126.2 3,286 22.4 5 (−15, 23) 0.99 (0.98, 1) 63 (50, 74) 27 (22, 33) 5 (1, 12) 1,634 (8.8) 198 Henan (WT) 2 (5) 13.2 34.7 113.1 3,015 98.2 15 (1, 26) 0.98 (0.97, 0.99) 61 (51, 79) 27 (22, 35) 5 (1, 11) 1,581 (11.9) 207 Hubeib (ST) 4 (9) 21.1 30.9 112.6 3,320 41.7 17 (4, 28) 1 (0.99, 1.01) 74 (70, 78) 32 (30, 35) 11 (4, 19) 3,829 (18.2) 838 Hunanb (ST) 3 (9) 14.2 27.4 113.0 2,990 92.5 18 (6, 30) 1 (0.99, 1.01) 73 (66, 78) 32 (30, 34) 15 (7, 25) 3,750 (26.5) 657 Mongolia (MT) 2 (6) 4.7 40.8 110.8 5,897 42.4 8 (−10, 24) 0.9 (0.89, 0.9) 49 (34, 59) 21 (15, 26) 3 (0, 7) 971 (20.5) 129 Jiangsub (ST) 4 (9) 24.2 32.9 118.6 6,550 75.7 16 (3, 29) 1.01 (1, 1.03) 73 (67, 80) 32 (29, 36) 10 (4, 19) 3,912 (16.2) 709 Jiangxib (ST) 3 (5) 11.4 28.2 115.3 2,538 58.0 19 (6, 30) 1.01 (1, 1.02) 75 (69, 78) 33 (30, 34) 17 (7, 30) 1,698 (15.0) 274 Jilin (MT) 3 (6) 14.0 44.1 125.4 3,893 40.2 6 (−15, 23) 0.99 (0.98, 1) 60 (46, 76) 26 (20, 34) 5 (1, 12) 1,805 (12.9) 321 Liaoningb (WT) 7 (11) 26.5 40.7 122.6 5,158 34.0 10 (−7, 24) 1.01 (1, 1.02) 63 (52, 80) 27 (21, 36) 5 (1, 13) 3,409 (12.9) 341 Ningxia (MT) 4 (5) 4.8 37.6 106.0 3,188 24.7 10 (−7, 23) 0.87 (0.87, 0.88) 52 (37, 65) 23 (16, 28) 2 (0, 5) 1,122 (23.3) 164 Qinghai (C) 3 (5) 4.0 36.6 101.8 2,848 23.4 5 (−8, 17) 0.76 (0.75, 0.76) 56 (43, 71) 24 (18, 31) 4 (0, 9) 611 (15.2) 64 Shaanxi (WT) 2 (7) 12.8 34.3 108.8 3,175 59.2 10 (−4, 22) 0.88 (0.87, 0.89) 70 (55, 85) 30 (24, 37) 5 (1, 13) 1,258 (9.8) 309 Shandong (WT) 3 (7) 19.6 36.3 118.4 5,254 109.2 11 (−2, 23) 0.95 (0.94, 0.96) 64 (53, 82) 28 (23, 37) 8 (1, 22) 1,686 (8.6) 372 Shanghaib(ST) 1 (5) 18.2 31.3 121.5 11,563 4.7 18 (5, 29) 1.02 (1, 1.03) 72 (68, 76) 31 (29, 33) 12 (4, 20) 1,897 (10.5) 500 Shanxi (WT) 3 (5) 7.9 37.8 112.8 3,150 45.5 11 (−4, 25) 0.93 (0.92, 0.94) 57 (43, 73) 25 (19, 32) 4 (0, 8) 1,012 (12.7) 216 Sichuanb(ST) 4 (5) 18.3 30.2 104.0 2,538 111.6 18 (9, 26) 0.93 (0.92, 0.94) 70 (59, 78) 30 (25, 34) 11 (2, 24) 1,021 (5.6) 187 Tianjinb (WT) 1 (5) 9.7 39.2 117.2 9,160 23.5 13 (−3, 27) 1.02 (1, 1.03) 60 (48, 74) 26 (21, 33) 4 (0, 11) 1,342 (13.8) 316 Xinjiang (MT) 2 (4) 4.0 43.8 87.6 2,919 81.6 7 (−15, 23) 0.92 (0.91, 0.93) 58 (43, 78) 25 (18, 34) 2 (1, 3) 1,271 (31.6) 202 Yunnanb (ST) 4 (6) 19.1 24.8 103.0 1,982 17.8 17 (10, 21) 0.83 (0.82, 0.83) 68 (55, 78) 30 (23, 35) 9 (2, 22) 2,801 (14.7) 285 Zhejiangb (ST) 4 (8) 22.2 30.0 120.4 6,535 97.7 18 (5, 30) 1.01 (1, 1.02) 72 (70, 75) 31 (30, 33) 14 (6, 19) 3,288 (14.8) 672 a Number of cities and hospitals participating in surveillance. b Indicates year-round influenza surveillance before 2009 (all provinces switched to year-round surveillance in the post-2009 pandemic period). C, cold temperate; GRP, gross regional product; MT, mid-temperate; ST, subtropical; T, tropical; WT, warm temperate; We obtained daily meteorological data for each participating city during the study period, including temperature (minimum, maximum, mean), vapor pressure (minimum, maximum, mean), relative humidity (minimum, maximum, mean), rainfall, and hours of sunshine, as recorded by China Meteorological Administration (Table 1; Text S1) [22]. Province-level meteorological indicators were calculated as population-weighted averages of city-level data. Summary climate indicators were obtained by averaging the daily values of each climate factor by season (winter, Dec–Feb; spring, Mar–May; summer, Jun–Aug; fall, Sep–Nov), as well as calculating annual minimums and maximums. We also categorized the 30 provinces into six climatic zones on the basis of previous work [23], ranging from tropical to cold-temperate climates (Figure 1; Table 1). Estimates of Seasonal Characteristics To visualize the average seasonal signature of influenza in each province, we first estimated the proportion of influenza cases identified in each week of the respiratory season, averaged across all complete years available for study. This method provided an empirical measure of seasonality, while adjusting for differences in sampling intensity and viral activity over time and between provinces [1],[24]. Weekly province-level influenza virus positive isolates were standardized by the annual number of influenza specimens tested prior to further modeling [25]. Preliminary analyses using a wavelet approach [26],[27] did not reveal changes in periodicity over time, so we elected to use stationary methods to characterize influenza seasonality. To obtain quantitative seasonality estimates, we fitted multiple linear regression models to weekly influenza time series separately in each province, including harmonic terms representing annual and semi-annual periodicities (see Text S1 for full details and [4],[26],[28],[29]). Briefly, the model follows: where flui(t) are the weekly standardized counts of influenza positive A isolates (or B, or A+B combined) in province i; t is a running index for week; ai , bi , ci , di , and ei are the intercept and seasonality coefficients to be estimated from the data; and ε i (t) are normally distributed errors. On the basis of the estimated model coefficients representing harmonic terms, we extracted the amplitude of annual and semi-annual periodicities (AnnAmpi = sqrt(bi 2+ci 2) and SemiAnnAmpi = sqrt(di 2+ei 2)), and the annual peak timing (AnnPeakTimingi = −atan(ci /bi )). To control for different levels of influenza activity across provinces, we calculated the relative amplitudes of annual and semi-annual periodicities, obtained by dividing AnnAmpi and SemiAnnAmpi estimates by the mean of the flui (t) time series [26]. To estimate the relative contribution of semi-annual periodicity, we calculated the ratio between the amplitude of the semi-annual periodicity and the sum of the amplitudes of annual and semi-annual periodicities (ratioi = SemiAnnAmpi/(AnnAmpi +SemiAnnAmpi )). A ratio close to 1 is indicative of dominant semi-annual periodicity while a ratio close to 0 indicates dominant annual periodicity. Confidence intervals on estimates of relative amplitude, peak timing, and periodicity ratio were obtained by fitting seasonal regression models to 1,000 datasets resampled from the original data by block-bootstrap, which accounts for auto-correlation in weekly influenza incidences (Text S1). As a sensitivity analysis, we fitted joint seasonal regression models in all 30 provinces using mixed effects models, accounting for fixed effects for broad geographic regions and random effects for provinces (Text S1). This approach revealed nearly identical seasonal curves as in the province-stratified analysis, indicating that the information contained in province-specific influenza data was sufficient to fit separate models. In the remainder of the paper, we report the results of province-stratified analyses. Further sensitivity analyses were conducted by fitting logistic regression models to the weekly influenza percent positive (weekly number of positive/weekly number specimens tested), which has also been used in past influenza research (Text S1) [27],[30]. In addition to seasonal parameters derived from regression models, we also quantified the median epidemic duration in each of the 30 provinces, defined as the number of weeks in which the reported number of influenza viruses exceeded a relative threshold, set at 2.5% or 5% of the total number of influenza viruses reported during the respiratory season. As a sensitivity analysis we estimated epidemic duration on the basis of the weekly percent positive exceeding an absolute threshold, set at 5% or 10% of all specimens tested in the week. We also assessed whether duration estimates were affected by sampling scheme, in particular whether surveillance was conducted year-round or limited to the October–March period. As all analyses revealed important differences in the seasonality of influenza A and B, we present influenza A- and B-specific seasonal parameter estimates in the main text and refer to the Text S1 for aggregate analyses. Predictors of Influenza Seasonality Next, we searched for predictors of influenza seasonal characteristics, including geography (latitude, longitude), population size and density, human mobility patterns, surveillance intensity (number of viruses sampled, number of participating hospitals and cities), and climate variables (Table 1). As seasonal characteristics were not fixed parameters but rather parameters estimated from seasonal regression models, we used a hierarchical Bayesian approach with non-informative priors to regress seasonal parameters against putative predictors (Text S1). A subset of predictors was first identified by classical stepwise multivariate analysis and these predictors were then used in the Bayesian approach. The errors obtained by bootstrap resampling were considered as observation variances in the Bayesian approach. Epidemiological Regions Relevant for Control To assist with the design of routine influenza vaccination programs in China, in particular with regard to the optimal timing of vaccination, we set out to identify broad regions that share similar influenza epidemiological patterns. We applied hierarchical clustering using Ward's minimum variance method [31] to identify regional clusters, relying on the squared Euclidian pairwise difference between standardized influenza time series as the distance metrics [32]. We also performed sensitivity analyses using an alternative distance metric (Manhattan distance [32]) and clustering approach (complete linkage [33]). Finally, we applied stepwise linear discriminant analysis to identify the putative geographic, demographic, and climate predictors of the epidemiological regions defined by the cluster analysis. Results Sampling Intensity During the study period 2005–2011, the average number of samples tested for influenza averaged 2,200 annually by province, with most intense sampling in Guangdong province in Southern China (5,661 samples per year) and thinnest sampling in Qinghai province in Northwest China (611 samples per year; Table 1). This level of sampling corresponds to 1.81 respiratory samples tested on average per year per 10,000 population in China (range across provinces 0.56–4.58). On average, 371 influenza virus positive specimens were identified annually by province (range across provinces 64–838). Influenza Seasonal Characteristics by Province Empirical seasonality patterns and seasonal regression models Heatmaps representing weekly province-level laboratory-confirmed influenza time series and their empirical seasonal signature are provided in Figure 2, revealing a diversity of seasonality patterns across China. While northern China experienced epidemics concentrated in winter, and southernmost provinces experienced influenza activity in spring–summer, provinces at intermediate latitudes did not exhibit clear annual seasonality. 10.1371/journal.pmed.1001552.g002 Figure 2 Heatmaps of influenza epidemiological data by Chinese province, Oct 2005-Dec 2011. (A) Time series of weekly standardized influenza cases, sorted by increasing latitude from bottom to top. Dashed vertical lines represent the influenza A/H1N1pdm pandemic period, Apr 2009–Apr 2010. (B) Average seasonal distribution of influenza cases (excluding the pandemic period), plotted as the proportion of viruses isolated in each week of the year. Provinces conducting year-round surveillance are denoted by an asterix. Week 0 is the first week of October of each year. Seasonal regression of time series data allowed further quantification of influenza seasonal characteristics and confirmed important differences by geography and virus type. Seasonal models fitted reasonably well for all influenza subtypes combined, influenza A, and high latitude provinces (median R2 = 23%, range 3%–60%); however fit was poorer for influenza B (median R2 = 10%, range 0.1%–26%; see Figures S1 and S2 and Text S1 for time series plots and residuals). Model fit however was not related to sampling intensity for any of the influenza outcomes (p>0.19; Text S1). Periodicity Influenza A displayed strong annual periodicity in provinces above ∼33°N latitude, and weaker annual periodicity at lower latitudes (median relative amplitude of annual cycle, 140% [95% CI 128%–151%] in the 15 northern temperate provinces versus 37% [95% CI 27%–47%] in the 15 southern provinces, Wilcoxon test, p 0.6) (Figures 3 and 4). Overall, there was weak latitudinal gradient in importance of the semi-annual cycle, indicative of more intense semi-annual influenza A activity in southern China (slope −0.016 [95% CI −0.025 to −0.008], R2 = 0.31, p 0.79; p 0.24). Differences in epidemic duration by geography and virus type were robust to using more conservative epidemic thresholds (i.e., using higher thresholds, resulting in shorter duration estimates). Prevalence of influenza A and B Given observed differences in the seasonality of influenza by geography and virus type, we checked whether the relative predominance of these viruses also differed across China. We found that the median proportion of influenza B among all influenza virus positive specimens ranged between 5%–55% across provinces in the 7 study years, with increasing prevalence towards the south (Spearman rho = −0.71 between latitude and influenza B proportion; p 33°N) experience winter epidemics, southernmost provinces (latitude 60 y and school-age children, while Xi'an City in Shaanxi province and Ningbo City in Zhejiang province have provided annual influenza vaccines through government health insurance since 2004 and 2010, respectively. Vaccine coverage is expected to rise substantially with increasing data on national- and province-specific influenza disease burden [11],[15], seasonality, cost-effectiveness, and initiation of national and provincial-level immunization programs. Our study is prone to a number of limitations. Our results are based on a relatively short period of time, 2005–2011, which limited our ability to capture multiyear influenza periodicities. Sampling intensity was not constant throughout time and could have affected our results, although data standardization and sensitivity analyses suggest this was not a major issue. Since a fraction of the northern provinces did not conduct year-round surveillance before 2009, it would be useful to revisit seasonality patterns in key provinces bordering the 33°N latitude threshold with longer year-round surveillance time series. Our dataset was too coarse to evaluate influenza patterns at the city or hospital level. However, surveillance data were based on a single city for five of the 30 studied provinces (including two northern and three southern provinces; Table 1), and hence influenza surveillance in these five provinces is not subject to aggregation issues. In particular, two of these “single-city” provinces, Beijing and Tianjin, are immediate neighbors with nearly identical influenza patterns, suggesting that surveillance information from this dataset is robust and captures true geographical differences in disease dynamics. Since most of the influenza information came from relatively large cities, however, we were unable to assess the finer details of influenza spatial transmission, including potential differences between rural and urban areas. Previous work suggests that influenza activity in rural areas of Western China is generally synchronous with that of the more populous Eastern coastal areas [18]. We chose to exclude information pertaining the 2009 pandemic period to focus on the seasonality of inter-pandemic influenza, and it is unclear how the emergence of the pandemic virus perturbed seasonality of the resident (sub)types. However, sensitivity analyses limited to data from the pre-pandemic period confirmed our findings (not shown). Another caveat is the lack of information on influenza A/H1N1 seasonality, as sampling was too thin to explore A/H3N2 and A/H1N1 viruses separately, and the patterns reported here for influenza A reflect those of the dominant A/H3N2 subtype. We have provided here a statistical description of influenza seasonality in China to inform timing of vaccination, using a two-stage approach used in past research to characterize the circulation of influenza and other infections in large regions and assess potential links with climate [2],[26],[49]–[51]. Our approach improves on previous work by integrating uncertainty in seasonal estimates obtained in the first stage analysis in hierarchical Bayesian models. However, our relatively simple seasonal models (see also [4]) explain only a fraction of the variance in weekly influenza surveillance data (typically ≤50% for influenza A and ≤30% for influenza B). Year-to-year variability in influenza epidemiology, complex virus circulation patterns specific to China, and sampling issues, may all contribute to weak model fit. Further, there was residual auto-correlation in some of our province-specific models, although auto-correlation was taken into account in error estimates via a block-bootstrap approach. Further work could focus on fitting compartmental transmission model to evaluate the transmissibility of the virus in different regions of China, and assess differences in herd immunity thresholds for vaccination. Interestingly, the effective reproduction number of influenza is thought to be relatively similar between temperate and tropical countries, ranging from 1.1–1.4 [52], suggesting that background immunity and transmission dynamics are broadly similar across regions (although it likely varies between years [53]). Overall, more modeling work is needed to evaluate regional differences in the evolutionary and transmission dynamics of influenza and their association with climate and demographic factors [3],[8],[18],[54]–[56]. Conclusion In conclusion, our study uncovered intriguing differences in influenza seasonality between regions and virus types in China, some of which can be associated with climatic factors, and confirm previous reports from other regions [3],[26]. Further work should focus on quantifying the balance between climatic drivers, population mixing, and other factors affecting influenza seasonality patterns globally, which could differ by virus types and subtypes. Our work has practical implications for the design of routine immunization programs in China, and suggests the need for staggered timing of vaccination in three broad epidemiological regions. Further surveillance studies are warranted to confirm these seasonality patterns and assess the match between influenza strains circulating in different provinces and WHO vaccine recommendations [18]. As routine immunization campaigns are rolled out and local vaccine production improves in resource-limited regions, it will become increasingly important to ensure that vaccination strategies are optimally tailored to the local epidemiology of the disease. Supporting Information Figure S1 Fit of type-specific seasonal influenza models in three provinces representative of broad influenza epidemiological regions in China. Shanxi (latitude 37.8°N, northern temperate province experiencing winter seasonal influenza A and B epidemics), Hubei (latitude 30.9°N, mid-latitude subtropical province experiencing semi-annual influenza A epidemics), and Guangdong (22.9°N, southern subtropical province experiencing late spring influenza A epidemics). Blue curve, observed cases standardized by the annual number of specimens tested; red curve, seasonal model. Grey lines mark Jan 1st of each year, while the green lines mark the 2009 A/H1N1 pandemic season, which was not included in the model fitting procedure. Model is based on a linear regression with harmonic terms for annual and semi-annual periodicities. (TIFF) Click here for additional data file. Figure S2 Residuals of seasonal models presented in Figure S1 in three selected provinces. (TIF) Click here for additional data file. Figure S3 Estimates of periodicity and timing of influenza epidemics in China (A and B combined). (Left) Timing of annual influenza peaks, in weeks. Timing is color coded by season. (Center) Amplitude of annual periodicity, ranging from low (yellow) to high (red), as indicated in the legend. Amplitude is relative to the mean of the weekly influenza time series in each province. (Right) Importance of semi-annual periodicities, measured by the ratio of the amplitude of the semi-annual periodicity to the sum of the amplitudes of annual and semi-annual periodicities. Yellow indicates strongly annual influenza epidemics, while red indicates marked semi-annual activity. See also Figure S4. (TIF) Click here for additional data file. Figure S4 Latitudinal gradients in seasonality of total influenza activity (A and B combined) in China. Left: Relative amplitude of annual periodicity. Middle: Peak timing. Right: Contribution of the semi-annual cycle, measured by the ratio of the amplitude of the semi-annual cycle to the sum of the amplitudes of annual and semi-annual cycles. Open circles represent point estimates from seasonal regression models and horizontal dashed lines represent 95% confidence intervals based on 1,000 block-bootstrap samples. Purple lines represent linear regression of seasonal parameters against latitude (dashed line, unweighted regression; solid line, regression weighted by the inverse of the variance of province-specific seasonal estimates); R2 and p-values are indicated on the graphs. Colors represent different climatic zones (black, cold-temperate; blue, mid-temperate; green, warm-temperate; orange, subtropical; red, tropical). (TIFF) Click here for additional data file. Figure S5 Sensitivity analysis on seasonal estimates for influenza A (top) and B (bottom) using a different model structure. Same as Figure 4 but using a logistic seasonal model with binomial errors to model weekly percent positive for influenza A and B (weekly number of influenza positive/weekly number of specimens tested). Left: Relative amplitude of annual periodicity. Middle: Peak timing. Right: Contribution of the semi-annual cycle, measured by the ratio of the amplitude of the semi-annual cycle to the sum of the amplitudes of annual and semi-annual cycles. Open circles represent point estimates from seasonal regression models. Purple lines represent linear regression of seasonal parameters against latitude; p-values are indicated on the graphs. Colors represent different climatic zones (black, cold-temperate; blue, mid-temperate; green, warm-temperate; orange, subtropical; red, tropical). (TIF) Click here for additional data file. Figure S6 Latitudinal gradient in duration of influenza epidemics, by province and virus type. Duration is based on a relative measure (number of weeks with more than 2.5% of annual influenza virus isolated), or an absolute measure (number of weeks with more than 5% influenza percent positive). Top panels: influenza A and B combined; middle panels: influenza A; bottom panels: influenza B. Horizontal grey bars represent ±2 standard deviations based on inter-annual variability in the 7 study years. (TIF) Click here for additional data file. Figure S7 Influenza A (top) and B (bottom) epidemiological regions identified by cluster analysis. Epidemiological regions are based on hierarchical clustering (Ward's method), using the Euclidian distance between weekly standardized influenza time series. Provinces are color-coded by climatic region (black, cold-temperate; blue, mid-temperate; green, warm-temperate; orange, subtropical; red, tropical). (TIFF) Click here for additional data file. Figure S8 Sensitivity analyses on cluster algorithms used to define influenza epidemiological regions (compare with Figure 6 ). Top: using a different distance metric for pairwise differences between influenza time series (absolute distance, also known as Manhattan distance, instead of Euclidian distance). Bottom: using a different clustering algorithm (complete linkage instead of Ward). Analyses are based on total influenza activity. (TIFF) Click here for additional data file. Text S1 Description of supplementary information. (DOC) Click here for additional data file.
- Record: found
- Abstract: found
- Article: not found
Temporal Changes in Ebola Transmission in Sierra Leone and Implications for Control Requirements: a Real-time Modelling Study
Anton Camacho, Adam Kucharski, Yvonne Aki-Sawyerr … (2015)
Background: Between August and November 2014, the incidence of Ebola virus disease (EVD) rose dramatically in several districts of Sierra Leone. As a result, the number of cases exceeded the capacity of Ebola holding and treatment centres. During December, additional beds were introduced, and incidence declined in many areas. We aimed to measure patterns of transmission in different regions, and evaluate whether bed capacity is now sufficient to meet future demand. Methods: We used a mathematical model of EVD infection to estimate how the extent of transmission in the nine worst affected districts of Sierra Leone changed between 10th August 2014 and 18th January 2015. Using the model, we forecast the number of cases that could occur until the end of March 2015, and compared bed requirements with expected future capacity. Results: We found that the reproduction number, R, defined as the average number of secondary cases generated by a typical infectious individual, declined between August and December in all districts. We estimated that R was near the crucial control threshold value of 1 in December. We further estimated that bed capacity has lagged behind demand between August and December for most districts, but as a consequence of the decline in transmission, control measures caught up with the epidemic in early 2015. Conclusions: EVD incidence has exhibited substantial temporal and geographical variation in Sierra Leone, but our results suggest that the epidemic may have now peaked in Sierra Leone, and that current bed capacity appears to be sufficient to keep the epidemic under-control in most districts.

- Record: found
- Abstract: found
- Article: found
Ebola Cases and Health System Demand in Liberia
John M. Drake, RajReni Kaul, Laura W. Alexander … (2015)
Introduction The 2014 epidemic of Ebola virus in West Africa is an emerging public health and humanitarian crisis of epic dimensions [1]. This epidemic originated in an outbreak in Guéckédou, Guinea in December 2013. The Ministry of Health of Guinea and Médecins Sans Frontières (MSF) were alerted to clusters of an unknown disease with fever/vomiting/diarrhea and a high fatality rate on 10 and 12 March 2014, respectively [2]. Through human-to-human transmission, the virus subsequently spread to Liberia (29 March [3]), Sierra Leone (25 May [4]), Nigeria (22 July [5]), Senegal (29 August [6]), the United States (30 September [7]), and Mali (30 September [8]). On 8 August 2014, WHO determined the epidemic to be a “Public Health Emergency of International Concern.” This declaration obligated 194 signatory nations to participate in disease prevention, surveillance, control, response, and reporting [9]. On 6 October, the first transmission outside of Africa was documented in Spain [10]. As of 14 December, 18,603 persons were reported (but not confirmed) to have been infected with a fatality rate for those cases with known clinical outcome around 70% [1]. Due to widespread under-reporting, the true number of cases is widely believed to be considerably higher. Ongoing international support has included the shipment of large quantities of personal protective equipment, diagnostic laboratory apparatus, and materiel such as vehicles; provision of medical and logistical advisors from MSF, the US Centers for Disease Control & Prevention, and WHO, among others; and the construction of new treatment facilities [11]. A range of further clinical interventions, health policies, and aid are under consideration and at various stages of mobilization. Whether these are sufficient to achieve containment and/or what further actions might extend their reach remain unknown. Epidemic modeling provides a means for structured reasoning about such complex dynamical conditions, both with respect to the information contained in this epidemic’s history to date and prospective opportunities for intervention. While several models of the 2014 West Africa Ebola epidemic have been published, the majority of these are primarily aimed at estimating the basic reproduction number (R 0), a summary statistic that may be tremendously informative about the potential rate of spread and the magnitude of vaccination required to achieve herd immunity [12–14]. Knowing R 0 is less useful where human behaviors—including both public health interventions [15] and avoidance or denial in the community [16]—cause the epidemic to take a more irregular path [17]. Two models that incorporate more detail have been published. A paper by the WHO Response Team [1] proposes a renewal equation for the evolution of the epidemic through time, parameterized with case reports collected by MSF. But this model, which focuses on the time course of disease and conditions for transmission, does not account for the role of transmission setting. The model of Meltzer and colleagues [18] is more tactical, but provides little analytical insight. Here, we report on a model of intermediate complexity. Our goal was to produce a model that could be used to guide policy recommendations. A supporting objective was to perform analysis of a range of scenarios to identify how actions taken in the present may influence short and medium term prospects for containment. The model comprises separate probability distributions for the number of secondary cases arising among health care workers (HCWs) infected in hospitals, non-HCWs infected by hospitalized patients, non-HCWs infected during non-hospital nursing care, and non-HCW infected through burial practices. Infected individuals may be treated in the hospital or in the home. Hospital treatment is assumed to result in reduced transmission but is limited to a fixed number of available hospital beds. Cases in excess of hospital capacity are assumed to be treated in the home. Cases seeking hospitalization (whether capacity allows admission or not) are scored as a report, separating the total number of cases (which is unknown) from the number of cases reported. In contrast to the models in [1] and [18], this model allows for changing human behavior and epidemic interventions through time-varying rates of hospitalization, exposure of HCWs, and secure burial [19]. We use the theory of branching processes to derive an expression for the mean number of secondary infections. Methods Data Data were obtained from situation reports issued by WHO and the Liberia Ministry of Health (Fig. 1). All situation reports were pulled from the Liberia Ministry of Health or United Nations Office for the Coordination of Humanitarian Affairs (UN-OCHA) websites (http://reliefweb.int and http://humanitarianresponse.info). When values had to be interpolated, data from WHO outbreak reports were used. For provenance and reproducibility, we digitally entered our own data (data deposited in the Dryad repository: http://doi.org/10.5061/dryad.17m5q [20]). Reported cases were scored as the sum of suspected, probable, and confirmed cases. 10.1371/journal.pbio.1002056.g001 Figure 1 Weekly number of suspected, probable, and confirmed cases of Ebola virus in Liberia in the seven days terminating with each date (blue bars) and daily cumulative reports (gray line). Hospital capacity in Ebola treatment units (total number of beds in country, dark blue line) was compiled from non-governmental organizations, media, and government sources. Beginning in September 2014, the WHO situation reports were considered to be unreliable with respect to the timing of case reports and the epidemic curve is discontinued. The underlying data and code to generate this figure may be obtained by running the file “ebola-forecasting-main-text.R” deposited in the Dryad repository: http://doi.org/10.5061/dryad.17m5q; data from WHO situation reports. A Branching Process Model Model. We developed a discrete time, stochastic process model for Ebola transmission. The model considers the context in which transmission occurs and who is infected as a result. This framework allows a minimal set of subpopulation differences to be articulated that nonetheless reflect the major epidemiological properties of Ebola transmission, including hospital treatment versus community care, transmission at funerals, and scenario-dependent transmission risk differences during care-giving. The model comprises separate probability distributions for the number of secondary cases arising from (i) HCWs infected in hospitals, (ii) non-HCWs infected by hospitalized patients, (iii) non-HCWs infected during non-hospital nursing care, and (iv) non-HCW infected through burial practices. Infected individuals are considered to be treated either in the hospital or in the home (Fig. 2). 10.1371/journal.pbio.1002056.g002 Figure 2 Structure of a model for human-to-human transmission of Ebola virus. Flow of transmission is depicted through two generations of infection in a multi-type branching process model of Ebola virus transmission. Grey panels show that infected persons may be treated in either the community (C, blue paths) or hospital (H, purple paths). Community-treated patients may give rise to secondary infections in community members through nursing care (CM) or in the process of body preparation and burial (FNR). Hospital-treated patients may give rise to secondary infections in HCWs or visitors (VIS). Infected persons may either be treated in the community or in the hospital at rates that depend on the conditions under which the infection was acquired. Specifically, our model supposes that transmission is composed of five processes that result in 11 state transitions (Fig. 2). In the following description, numbers in parentheses correspond to labels in Fig. 2. Persons treated in the community give rise to a Poisson distributed number of secondary infections among community members at rate λ = Nq, where N is the number of contacts and q is the per contact probability of transmission. To accommodate heterogeneity in transmission, λ may be taken to be a random variable, in which case the number of secondary infections is negative binomially distributed with an additional parameter, θ, regulating dispersion (1). Persons treated in the hospital give rise to a Poisson distributed number of secondary infections among HCWs at rate λβα, where β is a multiplier for the additional contacts acquired through hospitalization and α is a multiplier for the effect of infection control interventions (2). Persons treated in the hospital may infect a Poisson distributed number of visitors at rate λh (3). It is assumed that all deceased hospitalized patients are given a secure burial. Persons treated in the community recover or are given a secure burial at rate g (and therefore do not give rise to any further secondary infections) and non-secure burial at rate 1 − g, giving rise to a Poisson distributed number of secondary infections at rate ϕ (4). Persons acquiring infection in the community (classes CM, VIS, and FNR) are hospitalized with probability h (6, 9, 11) or remain in the community with probability 1 − h (5, 8, 10). Infected HCWs are all assumed to be hospitalized (7). These processes constitute a multi-type branching process composed of mixtures and convolutions of the core probability distributions (Box 1). Branching process models allow for very flexible specification of the distribution of secondary cases. Our branching process does not account for the depletion of susceptibles at the population level, however, and is therefore appropriate during the exponential phase of epidemic spread and/or where spread is controlled through human intervention rather than self-limitation. We believe these assumptions are broadly consistent with the currently prevailing conditions in West Africa. Box 1. Branching Process Model Our model is made from mixtures and convolutions of the base distributions of secondary cases associated with community-based nursing, hospital care, and body preparation and burial. A mixture distribution describes the probability of random variables drawn from one of two or more component distributions. A convolution distribution describes the probability of random variables obtained by summing two or more other random variables. For instance, in our model, the distribution of secondary cases for persons who are treated in the community is a mixture of the secondary cases generated by those who recover or are provided a safe burial (which occurs with probability 0≤g(t)≤1) and those who die and are not provided a safe burial (which occurs with probability 0≤1−g(t)≤1). Secondary cases due to individuals who recover or receive safe burial derive exclusively from community-based transmission and are distributed as a negative binomial distribution with intensity parameter λ = Nq and dispersion θ. Secondary infections due to deceased patients who are not provided a safe burial is the sum of those due to community-based transmission and those due to funerary transmission. By assumption, funerary transmission gives rise to a Poisson distributed number of secondary infections with rate parameter ϕ. The convolution of a negative binomial distribution and a Poisson distribution is a Delaporte distribution. Thus, the distribution of total number of secondary infections from persons treated in the community is the mixture of a negative binomial distribution and a Delaporte distribution (arrows 1 and 2 in Fig. 2). Secondary cases generated by patients treated in the hospital is also a convolution of the infections of HCWs and visitors (arrows 3 and 4 in Fig. 2). Since the convolution of two Poisson distributions is a Poisson distribution, this distribution of secondary cases is Poisson with rate parameter (λβα+λh ). The number of secondary cases in each infection generation is a mixture (with mixing parameter h) of community-acquired, funerary, and hospital-visitor-acquired cases that are treated in the community (arrows 5, 7, and 9 in Fig. 2) and those that are treated in a hospital (arrows 6, 8, 10, and 11 in Fig. 2). The different forecasting scenarios we analyzed reflect assumptions about how the availability of hospital beds and hospitalization rates affect this mixture. These considerations directly lead to the mean matrix of secondary infections by type (equation 1 in S1 Text) and the analytic expression for Reff (equations 2 and 3 in S1 Text). Hospital capacity. In simulations, hospital treatment was assumed to result in reduced transmission, limited by the number of available hospital beds. Patients seeking hospitalization in excess of hospital capacity were assumed to be returned to the home for treatment. Only patients seeking hospitalization (whether capacity allowed admission or not) were scored as a report, separating the total number of cases (which in reality is unknown) from the number of cases reported. Parameterization To parameterize this model, we were initially guided by reports on the outbreaks of Ebola virus in Kikwit (Democratic Republic of Congo) in 1995 [21–24] and Gulu (Uganda) in 2000–2001 [25–27]. The values obtained in this section were used as a starting point for a more systematic analysis, as described in the section “Plausible Parameter Sets.” Transmission (N, q, θ) and the effectiveness of infection control (α). The attack rate in Kikwit was 9% among hospital workers [28] and 16% among family members [22]. The ratio of exposures to index cases in households was N = 173/27 = 6.4 for 27 different families. Assuming exposure was only within the family (so each secondary case had only one exposure), we have q = 0.16 (risk of transmission per contact). At Kikwit General Hospital, 37 of 429 workers met the case definition for Ebola virus disease. A reported three cases occurred after the use of barrier nursing. If we assume that these three were all in Kikwit General Hospital, then 34 HCWs were infected prior to infection control. A total of 110 out of 138 other hospital workers reported direct contact with an Ebola patient. Extrapolating to the 392 HCWs who weren’t infected, we estimate the number of workers with direct contact to be 110/138×392+34≈ 346 yielding an attack rate of 9.8%. Of course, hospital workers experience greater exposure than persons providing care in the community. Among 48 uninfected persons with direct contact jobs at Kikwit General Hospital there were a total of 151 patient contacts (3.15 contacts per worker). If this were representative, then we would have the relation 1−(1−qα)3.15 = 0.098, yielding α = 0.20 prior to the implementation of barrier nursing and other infection control measures. Following barrier nursing, three out of 110/138×392+3≈ 315 HCWs were infected, yielding an attack rate of 0.95%. Using the relation 1−(1−qα)3.15 = 0.0095 we obtain α = 0.019 after the implementation of barrier nursing and other infection control measures. Hospital contact multiplier (β). The parameter β relates the number of contacts in a health facility to those in a household and is expressed as a multiplier of N. This value is chosen based on intuition and narrative reports. In general, we consider values in the range 2 αβ). Such formulas may provide “rules of thumb” to help guide infection control or could improve practical decision making by regularly updating estimates of core parameters through surveillance within health facilities. The approach we have taken to model parameterization is novel. A more familiar approach is to propose a deterministic or stochastic model that is then fit by minimizing an objective function on the errors, e.g., sum of squared errors or negative log likelihood of the data given the model [29]. Statistical interpretation of such models (such as hypothesis tests or confidence intervals) relies heavily on the parametric specification of both the process model and the observation model. If the proposed models are not good approximations to their respective contributions to the data-generating process (that is, they have considerable “structural error”), then these quantities may be quite biased. Moreover, such models are ineffective when they are overparameterized. Our approach—the construction of plausible parameter sets that are both epidemiologically sensible and can reproduce observed properties of the epidemic—seeks instead to understand the space of models consistent with the data. The cost of this approach is that the results do not admit probabilistic interpretations, hypothesis tests, or traditional confidence intervals. A byproduct is that the identifiability of parameters (which is compromised by overparameterization) is no longer an obstacle to model construction and forecasting. If two parameters, say a and b, are highly correlated (not simultaneously identifiable) so that either the model with large a and small b or large b and small a are both consistent with the data, then the plausible set will include parameter combinations with examples of both kinds (but not, for example, large a and large b or small a and small b). It may be that these differences are in fact irrelevant to the eventual behavior of the model, in which case the space of possible solutions will be small. Alternatively, it may be that these are just the parameters that most substantially influence alternative outcomes, in which case the space of possible solutions will be large. By seeking bounds on the range of outcomes rather than a unique causal story, the method of plausible parameter sets avoids technical problems with model identifiability and more accurately emphasizes the kind of uncertainty prevalent under emergent conditions while focusing attention on the property of most practical interest: the possible future trajectories of the epidemic. In conclusion, we believe that the method of plausible parameter sets is a good starting point for exploring entire families of models and for setting bounds on the range of possible outcomes. It is a first step toward the construction of models for probabilistic inference. In this study, we have focused on Liberia, which initially experienced the fastest epidemic growth. The ramping up of hospital capacity in Liberia was dramatic during late August 2014, adding approximately 300 beds. Throughout September, that sustained effort led to an additional ~300 beds. This heterogeneous increase in capacity over time was incorporated into our model. We investigated alternative hospital capacities and demands in a set of plausible alternative scenarios. The best and worse outcomes of these scenarios vary dramatically in the forecasted epidemic size (S12 Fig). Median estimates were at around 130,000 cases by 31 December 2014 assuming a baseline scenario without increased hospital capacity. This was reduced to around 50,000 when capacity was ramped up to ~1,700. Further increases in hospital capacity were shown to reduce the upper bound on our predictions, but did not substantially affect the median. Our initial model suggested that if the hospitalization rate could be increased to 85% then it was probable that the epidemic would be contained. The updated model confirms this result and predicts near elimination sometime between March and June of 2015. The updated model also highlights the continued need for vigilance, however, suggesting that if hospitalization returns to prior levels the current outbreak may exhibit an extremely prolonged right tail. In conclusion, these modeling exercises suggested that in the absence of rapid hospitalization of most cases, none of the proposed scenarios for increasing hospital capacity would have been likely to achieve containment. Continuing on the path to elimination will require sustained watchfulness and individual willingness to be treated. Although broadly consistent with our narrative understanding of the epidemiology of Ebola virus disease in West Africa, the model we developed does not account for some known features of transmission, mainly because we believe these effects to be small relative to the processes represented. For instance, the size of the at-risk population of HCWs has varied over time, which may account for some of the fluctuations in infection within this group of people (Fig. 4). Our model assumes that the number of contacts between HCWs and infected persons is proportional to the number of infected persons limited by hospital capacity. To the extent that individual care was reduced because of exhaustion or movement of the care-giving workforce early in the epidemic, our model is unrealistic. Individual case information will be required to determine the magnitude of this effect. Similarly, our model attributes the decline in transmission primarily to hospitalization and safe burial, but not improved infection control in the hospital setting, better and safer use of personal protective equipment, or social distancing. We believe that infection control and effective use of protective equipment are in fact key elements to containing Ebola and may account for some of the proportional decline in transmission to HCWs shown in Fig. 4. Changes in transmission in the hospital environment were not included in our model for the technical reason that time-varying hospital transmission and time-varying safe burial could not be simultaneously estimated together with evidence that (i) by late summer, transmission to HCWs was a small fraction of transmission overall, and (ii) our model already attributes a high level of effectiveness to infection control (see section “Transmission and the effectiveness of infection control”). Effects of social distancing are probably captured numerically by our model in the estimated decline in funerary transmission. To the extent that transmission has been reduced by diffuse social distancing—including the use of safety precautions in households of infected persons—our estimate of the safe burial rate will be biased. The upshot is that our model may be numerically accurate, although g may not reflect the true safe burial rate. To the extent that declines in transmission are due to changes other than increased hospital capacity and safe burial, the projected benefits of future increases in hospital capacity may be exaggerated. In this respect, our forecasts are conjectures based on current understanding. Branching process models use offspring distributions to simulate forward in time. Here, the offspring of an infectious individual refers to the new cases generated from that infectious individual. This is the type of data that is frequently reported, even during early stages of an outbreak. Models that require separate quantities for the probability of infection and number of contacts are complicated by the fact that there is uncertainty about whether contact is effective or not. For example, how many “contacts” of an infectious individual transported by airplane are sufficiently intimate that infection is even a causal possibility? Ambiguities about the causal relevance of contacts of different kinds complicate models expressed in terms of attack rates. By focusing on the empirical offspring distributions in various transmission settings, one is able to build, simulate, and analyze a model with the key epidemiological features, and to investigate a wide range of mitigation scenarios. In our case, the result was a multi-type branching process that separated the location that infection was acquired from the sites generating new infections. This approach captures the behavioral aspects of transmission that are often lacking in models [38]. Awareness of Ebola in the community and public education mean that community-acquired transmission is increasingly likely to lead to demand for hospitalization. While our methods are focused on the current Ebola outbreak in West Africa, they apply to a broad class of infectious diseases. Supporting Information S1 Fig Cumulative reported cases in data (red lines) and model simulations (box-and-whisker plots). The left three panels show results for HCWs, reported cases, and reported and unreported cases (assuming 2.5-fold under-reporting). The remaining panels show the model-predicted distributions of hospital-acquired infections and funeral-acquired infections. The underlying data and code to generate this figure may be obtained by running the file “ebola-forecasting-supplement.R” deposited in the Dryad repository: http://doi.org/10.5061/dryad.17m5q. (PDF) Click here for additional data file. S2 Fig Daily number of persons seeking hospitalization (bottom) when transmission occurs at the baseline rate. Inset plot shows the median daily number of cases. The underlying data and code to generate this figure may be obtained by running the file “ebola-forecasting-supplement.R” deposited in the Dryad repository: http://doi.org/10.5061/dryad.17m5q. (PDF) Click here for additional data file. S3 Fig Number of cases in each infection generation under Scenario A. The underlying data and code to generate this figure may be obtained by running the file “ebola-forecasting-supplement.R” deposited in the Dryad repository: http://doi.org/10.5061/dryad.17m5q. (PDF) Click here for additional data file. S4 Fig Daily number of persons seeking hospitalization (bottom) according to Scenario A. Inset plot shows the median daily number of cases. The underlying data and code to generate this figure may be obtained by running the file “ebola-forecasting-supplement.R” deposited in the Dryad repository: http://doi.org/10.5061/dryad.17m5q. (PDF) Click here for additional data file. S5 Fig Number of cases in each infection generation under Scenario B. The underlying data and code to generate this figure may be obtained by running the file “ebola-forecasting-supplement.R” deposited in the Dryad repository: http://doi.org/10.5061/dryad.17m5q. (PDF) Click here for additional data file. S6 Fig Daily number of persons seeking hospitalization (bottom) according to Scenario B. Inset plot shows the median daily number of cases. The underlying data and code to generate this figure may be obtained by running the file “ebola-forecasting-supplement.R” deposited in the Dryad repository: http://doi.org/10.5061/dryad.17m5q. (PDF) Click here for additional data file. S7 Fig Number of cases in each infection generation under Scenario C. The underlying data and code to generate this figure may be obtained by running the file “ebola-forecasting-supplement.R” deposited in the Dryad repository: http://doi.org/10.5061/dryad.17m5q. (PDF) Click here for additional data file. S8 Fig Daily number of persons seeking hospitalization (bottom) according to under Scenario C. Inset plot shows the median daily number of cases. The underlying data and code to generate this figure may be obtained by running the file “ebola-forecasting-supplement.R” deposited in the Dryad repository: http://doi.org/10.5061/dryad.17m5q. (PDF) Click here for additional data file. S9 Fig Number of cases in each infection generation under Scenario D. The underlying data and code to generate this figure may be obtained by running the file “ebola-forecasting-supplement.R” deposited in the Dryad repository: http://doi.org/10.5061/dryad.17m5q. (PDF) Click here for additional data file. S10 Fig Daily number of persons seeking hospitalization (bottom) according to under Scenario D. Inset plot shows the median daily number of cases. The underlying data and code to generate this figure may be obtained by running the file “ebola-forecasting-supplement.R” deposited in the Dryad repository: http://doi.org/10.5061/dryad.17m5q. (PDF) Click here for additional data file. S11 Fig Cumulative distribution function (left) and histogram (right) of the total epidemic size (top) and epidemic duration in days after 2 September 2014 (bottom) in a containment scenario (Scenario D). The underlying data and code to generate this figure may be obtained by running the file “ebola-forecasting-supplement.R” deposited in the Dryad repository: http://doi.org/10.5061/dryad.17m5q. (PDF) Click here for additional data file. S12 Fig Robustness of the method of plausible parameter sets. Panels show the distribution of number of cases by December 31, 2014 in five scenarios. Scenario A reflects increased hospital capacity from US Department of Defense (DoD) commitment of 15 September. Scenario B assumed significantly increased hospital capacity in excess of Scenario A. Scenario C reflects significantly increased hospital capacity and increased hospitalization rates. Scenario D reflects significantly increased hospital capacity and significantly increased hospitalization. Light blue shaded regions show outcomes from the latin hypercube neighborhood of ±25% of the best fit values. Gray lines show the range of outcomes from a larger parameter space (latin hypercube sampling within ±50% of the least squares estimates). Dark blue lines show the range of outcomes from a smaller parameter space (latin hypercube sampling within ±10% of the least squares estimates). These simulations show that even very different endpoints to the sampled parameter region do not change the primary qualitative conclusions of this study. The underlying data and code to generate this figure may be obtained by running the file “ebola-forecasting-supplement.R” deposited in the Dryad repository: http://doi.org/10.5061/dryad.17m5q. (PDF) Click here for additional data file. S13 Fig Parameter pairs in plausible parameter sets obtained from a latin hypercube sample in a neighborhood ±25% of the estimated values. Correlation coefficients (absolute value) are shown in the subdiagonal plots; values greater than 0.25 are highlighted in blue. The underlying data and code to generate this figure may be obtained by running the file “ebola-forecasting-supplement.R” deposited in the Dryad repository: http://doi.org/10.5061/dryad.17m5q. (PDF) Click here for additional data file. S14 Fig Parameter pairs in plausible parameter sets obtained from a latin hypercube sample in a neighborhood ±10% of the estimated values. Correlation coefficients (absolute value) are shown in the subdiagonal plots; values greater than 0.25 are highlighted in blue. The underlying data and code to generate this figure may be obtained by running the file “ebola-forecasting-supplement.R” deposited in the Dryad repository: http://doi.org/10.5061/dryad.17m5q. (PDF) Click here for additional data file. S15 Fig Parameter pairs in plausible parameter sets obtained from a latin hypercube sample in a neighborhood ±50% of the estimated values. Correlation coefficients (absolute value) are shown in the subdiagonal plots; values greater than 0.25 are highlighted in blue. The underlying data and code to generate this figure may be obtained by running the file “ebola-forecasting-supplement.R” deposited in the Dryad repository: http://doi.org/10.5061/dryad.17m5q. (PDF) Click here for additional data file. S1 Text Expression for the effective reproduction number and supplementary analysis. (PDF) Click here for additional data file.
Author and article information
Journal
Title:
Proceedings of the National Academy of Sciences
Abbreviated Title:
Proc Natl Acad Sci USA
Publisher:
Proceedings of the National Academy of Sciences
ISSN
(Print):
0027-8424
ISSN
(Electronic):
1091-6490
Publication date Created:
April
19 2016
Publication date Created:
April
19 2016
Publication date
(Print):
April
19 2016
Publication date
(Electronic):
March
28 2016
Volume: 113
Issue: 16
Pages: 4488-4493
Article
DOI: 10.1073/pnas.1518587113
PMC ID: 4843458
PubMed ID: 27035948
SO-VID: 355d9164-efd7-4bfb-a0bc-b46a766f863f
Copyright © ©
2016
History
Data availability: