- Record: found
- Abstract: found
- Article: found
County-Level COVID-19 Vaccination Coverage and Social Vulnerability — United States, December 14, 2020–March 1, 2021
research-article
Michelle M. Hughes , PhD
1
,
,
Alice Wang , PhD
1 ,
Marissa K. Grossman , PhD
1
,
2 ,
Eugene Pun , MPH
1
,
3 ,
Ari Whiteman , PhD
1
,
2 ,
Li Deng , PhD
1 ,
Elaine Hallisey , MA
2 ,
J. Danielle Sharpe , MS
1
,
2 ,
Emily N. Ussery , PhD
1 ,
Shannon Stokley , DrPH
1 ,
Trieste Musial , MS
2 ,
Daniel L. Weller , PhD
1 ,
Bhavini Patel Murthy , MD
1 ,
Laura Reynolds , MPH
1 ,
Lynn Gibbs-Scharf , MPH
1 ,
LaTreace Harris , MPH
1 ,
Matt D. Ritchey , DPT
1 ,
Robin L. Toblin , PhD
1
26 March 2021
Read this article at
There is no author summary for this article yet. Authors can add summaries to their articles on ScienceOpen to make them more accessible to a non-specialist audience.
Abstract
The U.S. COVID-19 vaccination program began in December 2020, and ensuring equitable
COVID-19 vaccine access remains a national priority.* COVID-19 has disproportionately
affected racial/ethnic minority groups and those who are economically and socially
disadvantaged (
1
,
2
). Thus, achieving not just vaccine equality (i.e., similar allocation of vaccine
supply proportional to its population across jurisdictions) but equity (i.e., preferential
access and administration to those who have been most affected by COVID-19 disease)
is an important goal. The CDC social vulnerability index (SVI) uses 15 indicators
grouped into four themes that comprise an overall SVI measure, resulting in 20 metrics,
each of which has national and state-specific county rankings. The 20 metric-specific
rankings were each divided into lowest to highest tertiles to categorize counties
as low, moderate, or high social vulnerability counties. These tertiles were combined
with vaccine administration data for 49,264,338 U.S. residents in 49 states and the
District of Columbia (DC) who received at least one COVID-19 vaccine dose during December
14, 2020–March 1, 2021. Nationally, for the overall SVI measure, vaccination coverage
was higher (15.8%) in low social vulnerability counties than in high social vulnerability
counties (13.9%), with the largest coverage disparity in the socioeconomic status
theme (2.5 percentage points higher coverage in low than in high vulnerability counties).
Wide state variations in equity across SVI metrics were found. Whereas in the majority
of states, vaccination coverage was higher in low vulnerability counties, some states
had equitable coverage at the county level. CDC, state, and local jurisdictions should
continue to monitor vaccination coverage by SVI metrics to focus public health interventions
to achieve equitable coverage with COVID-19 vaccine.
COVID-19 vaccine administration data are reported to CDC by multiple entities via
immunization information systems (IIS), the Vaccine Administration Management System,
or direct data submission.
†
Vaccination coverage was defined as the number of residents who received at least
one dose of COVID-19 vaccine during December 14, 2020–March 1, 2021, and whose data
were reported to CDC by March 6, 2021.
§
Total county population denominators used to create vaccination coverage estimates
were obtained from the U.S. Census Bureau 2019 Population Estimates Program.
¶
Social vulnerability data were obtained from the CDC SVI 2018 database,** which includes
metrics to identify communities that might need additional support during emergencies,
including the COVID-19 pandemic (Supplementary Figure 1, https://stacks.cdc.gov/view/cdc/104111).
County-level social vulnerability rankings for 15 SVI indicators, four SVI themes,
and the overall SVI (20 total SVI metrics) were used.
††
Each of the SVI metrics was categorized into national
§§
and state-specific
¶¶
tertiles*** (low, moderate, and high social vulnerability) based on their national
(among all U.S. counties) or state (among each state’s counties) rank.
Vaccination coverage (percentage of residents who received at least one COVID-19 vaccine
dose) and 95% confidence intervals (CIs) within SVI tertiles were calculated for each
of the 20 SVI metrics for the national analyses, with jurisdictional exclusions based
on missing data for state of residence, missing data for county of residence (Hawaii,
which did not systematically report these data), or no available SVI metrics (eight
territories and freely associated states).
†††
A vaccination rate ratio (RR) and 95% CI for each SVI metric was calculated using
Wald’s unconditional maximum likelihood estimation to assess the relative differences
in vaccination coverage, comparing low and moderate vulnerability counties with high
vulnerability counties. The rate difference was also calculated to assess the difference
between SVI tertiles. Because of the large sample sizes, rather than using statistical
significance to determine meaningful differences between tertiles, a difference of
≥0.5 percentage points was used. State-level analyses for the overall SVI and four
SVI themes were conducted among states with more than three counties. In addition,
vaccination coverage for SVI metrics (national analyses) and SVI metrics within states
(state-level analyses) were normalized so that the sum across tertiles was one.
§§§
(When vaccination coverage is equally distributed among tertiles within an SVI metric,
the proportion of persons vaccinated in each SVI tertile is 0.33.) This activity was
reviewed by CDC and was conducted consistent with applicable federal law and CDC policy.
¶¶¶
During December 14, 2020–March 1, 2021, a total of 51,873,700 residents of 49 U.S.
states and DC received at least one dose of COVID-19 vaccine. County of residence
was available for 95.0% (49,264,338) of these records for analysis. National first-dose
vaccination coverage was 15.1%. For overall SVI, vaccination coverage was 1.9 percentage
points higher in low vulnerability counties than in high vulnerability counties (15.8%
versus 13.9%, respectively) (Table). The same pattern was found for the SVI themes
of socioeconomic status, household composition and disability status, and racial/ethnic
minority status and language, with the largest vaccination coverage disparity in the
socioeconomic status theme (difference of 2.5 percentage points). Vaccination coverage
was ≥0.5 percentage points lower in low vulnerability counties than in high vulnerability
counties for the following indicators: 1) population aged ≥65 years (2.3 percentage
points lower), 2) multiunit housing (1.3 percentage points lower), and 3) households
with no vehicle (0.7 percentage points lower) (Figure 1). Indicators associated with
similar coverage in low and high vulnerability counties were 1) percentage of persons
with a disability and 2) percentage of persons who speak English “less than well.”
Vaccination coverage was higher in low vulnerability counties than in high vulnerability
counties for the remaining 10 indicators. Among socioeconomic status indicators, the
largest disparity was the percentage of adults without a high school diploma (difference
of 2.8 percentage points between high and low vulnerability counties). The majority
of vaccination coverage differences between tertiles were <2 percentage points.
TABLE
Association between county-level COVID-19 vaccination coverage and social vulnerability
index (SVI) metrics among persons who received at least one vaccine dose (N = 49,264,338)
— United States, December 14, 2020–March 1, 2021*
SVI metric†
Vaccination coverage estimate§ (95% CI)
Rate ratio for relative differences in vaccination coverage (95% CI)**
Rate differences in vaccination coverage††
Low social vulnerability¶
Moderate social vulnerability¶
High social vulnerability¶
Low versus high estimate
Moderate versus high estimate
Low–high
Moderate–high
Overall SVI
15.8 (15.83−15.84)
15.6 (15.57−15.59)
13.9 (13.89−13.90)
1.1 (1.14−1.14)
1.1 (1.12−1.12)
1.94
1.69
Socioeconomic status
Total
15.9 (15.91−15.92)
15.0 (14.97−14.98)
13.5 (13.45−13.46)
1.2 (1.18−1.18)
1.1 (1.11−1.11)
2.46
1.52
Poverty
15.9 (15.85−15.86)
14.8 (14.79−14.80)
14.2 (14.21−14.23)
1.1 (1.11−1.12)
1.0 (1.04−1.04)
1.64
0.58
Unemployment
15.4 (15.38−15.40)
15.3 (15.30−15.31)
14.5 (14.54−14.55)
1.1 (1.06−1.06)
1.1 (1.05−1.05)
0.85
0.76
Per capita income
15.6 (15.57−15.58)
14.4 (14.35−14.37)
13.5 (13.45−13.48)
1.2 (1.16−1.16)
1.1 (1.07−1.07)
2.11
0.90
No high school diploma
16.0 (16.01−16.02)
15.3 (15.26−15.27)
13.2 (13.22−13.23)
1.2 (1.21−1.21)
1.2 (1.15−1.16)
2.79
2.04
Household composition and disability status
Total
15.6 (15.62−15.63)
14.4 (14.41−14.42)
14.2 (14.20−14.22)
1.1 (1.10−1.10)
1.0 (1.01−1.02)
1.42
0.21
Age ≥65 yrs
14.6 (14.58−14.59)
15.9 (15.89−15.91)
16.9 (16.90−16.92)
0.9 (0.86−0.86)
0.9 (0.94−0.94)
−2.32
−1.01
Age ≤17 yrs
16.6 (16.57−16.58)
15.5 (15.51−15.53)
13.6 (13.56−13.57)
1.2 (1.22−1.22)
1.1 (1.14−1.14)
3.01
1.95
Disability
15.1 (15.13−15.14)
15.0 (14.95−14.97)
14.9 (14.88−14.90)
1.0 (1.02−1.02)
1.0 (1.00−1.01)
0.24
0.07
Single parent
16.7 (16.68−16.70)
15.6 (15.55−15.56)
14.0 (13.99−14.00)
1.2 (1.19−1.19)
1.1 (1.11−1.11)
2.70
1.56
Racial/Ethnic minority status and language
Total
15.5 (15.45−15.48)
15.6 (15.56−15.58)
14.9 (14.90−14.91)
1.0 (1.04−1.04)
1.0 (1.04−1.05)
0.57
0.67
Racial/Ethnic minority
15.5 (15.51−15.54)
15.7 (15.66−15.67)
14.8 (14.75−14.76)
1.1 (1.05−1.05)
1.1 (1.06−1.06)
0.77
0.91
Limited English
15.3 (15.30−15.33)
15.5 (15.47−15.49)
14.9 (14.93−14.93)
1.0 (1.02−1.03)
1.0 (1.04−1.04)
0.38
0.55
Housing type and transportation
Total
14.8 (14.81−14.82)
15.3 (15.25−15.26)
15.0 (15.03−15.05)
1.0 (0.98−0.99)
1.0 (1.01−1.01)
−0.23
0.21
Multiunit housing
14.0 (13.96−13.99)
14.5 (14.49−14.51)
15.2 (15.24−15.24)
0.9 (0.92−0.92)
1.0 (0.95−0.95)
−1.26
−0.74
Mobile homes
15.2 (15.22−15.23)
15.1 (15.05−15.07)
14.0 (13.98−14.00)
1.1 (1.09−1.09)
1.1 (1.08−1.08)
1.24
1.07
Crowding
16.1 (16.08−16.10)
15.1 (15.09−15.11)
14.7 (14.65−14.66)
1.1 (1.10−1.10)
1.0 (1.03−1.03)
1.43
0.45
No vehicle
14.5 (14.49−14.51)
15.4 (15.35−15.36)
15.2 (15.15−15.16)
1.0 (0.96−0.96)
1.0 (1.01−1.01)
−0.66
0.20
Group quarters
15.9 (15.85−15.86)
14.8 (14.79−14.80)
14.2 (14.21−14.23)
1.1 (1.11−1.12)
1.0 (1.04−1.04)
1.64
0.58
Abbreviation: CI = confidence interval.
* Vaccines administered to residents of 49 U.S. states (excluding Hawaii) and the
District of Columbia during December 14, 2020–March 1, 2021, and reported to CDC by
March 6, 2021.
† SVI ranks counties according to 15 social factors (indicators): 1) percentage of
persons with incomes below poverty threshold, 2) percentage of civilian population
(aged ≥16 years) that is unemployed, 3) per capita income, 4) percentage of persons
aged ≥25 years with no high school diploma, 5) percentage of persons aged ≥65 years,
6) percentage of persons aged ≤17 years, 7) percentage of civilian noninstitutionalized
population with a disability, 8) percentage of single-parent households with children
aged <18 years, 9) percentage of persons who are racial/ethnic minorities (all persons
except non-Hispanic White), 10) percentage of persons aged ≥5 years who speak English
“less than well,” 11) percentage of housing in structures with ≥10 units (multiunit
housing), 12) percentage of housing structures that are mobile homes, 13) percentage
households with more persons than rooms (crowding), 14) percentage of households with
no vehicle available, and 15) percentage of persons in group quarters. Estimates are
created using 2014–2018 (5-year) data from the American Community Survey. The 15 indicators
are categorized into four themes: 1) socioeconomic status (indicators 1–4), 2) household
composition and disability (indicators 5–8), 3) racial/ethnic minority status and
language (indicators 9 and 10), and 4) housing type and transportation (indicators
11–15). Overall SVI includes all 15 indicators as a composite measure. Additional
details are available (https://www.atsdr.cdc.gov/placeandhealth/svi/documentation/SVI_documentation_2018.html).
§ Total county population denominators used to create vaccination coverage estimates
were obtained from the U.S. Census Bureau 2019 Population Estimates Program (https://www.census.gov/data/datasets/time-series/demo/popest/2010s-counties-total.html).
Vaccination coverage was calculated as the total number of vaccine doses administered
divided by the total population size for included counties in each SVI tertile.
¶ Counties were assigned to tertiles (low, moderate, and high social vulnerability)
for each of the 20 SVI ranking metrics.
** Rate ratios compare the relative difference in vaccination coverage between SVI tertiles;
high social vulnerability is the reference category.
†† Rate differences compare the difference in vaccination coverage between SVI tertiles;
high social vulnerability is the reference category. Vaccination coverage differences
of ≥0.5 percentage points were considered meaningful differences between SVI tertiles.
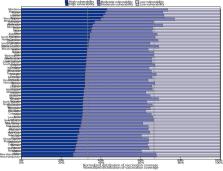
FIGURE 1
Distribution of county-level* COVID-19 vaccination coverage among persons who received
at least one vaccine dose (N = 49,264,338),
†
by social vulnerability index (SVI) metric
§
and tertile — United States, December 14, 2020–March 1, 2021
* Counties were assigned to tertiles (low, moderate, and high) for overall SVI. Data
are presented as a 100% stacked bar chart (normalized across states), with the length
of each bar segment representing the proportion of total vaccination coverage for
each SVI tertile. When proportions of vaccination coverage are equal among SVI tertiles,
each proportion represents 0.33, represented by the vertical lines. When proportions
of vaccination coverage estimates are not equally distributed among SVI tertiles,
then proportions do not align with threshold lines representing 0.33.
† Vaccines administered to residents of 49 U.S. states (excluding Hawaii) and the
District of Columbia during December 14, 2020–March 1, 2021, and reported to CDC by
March 6, 2021.
§ SVI ranks counties according to 15 social factors (indicators): 1) percentage of
persons with incomes below poverty threshold, 2) percentage of civilian population
(aged ≥16 years) that is unemployed, 3) per capita income, 4) percentage of persons
aged ≥25 years with no high school diploma, 5) percentage of persons aged ≥65 years,
6) percentage of persons aged ≤17 years, 7) percentage of civilian noninstitutionalized
population with a disability, 8) percentage of single-parent households with children
aged <18 years, 9) percentage of persons who are racial/ethnic minorities (i.e., all
persons except those who are non-Hispanic White), 10) percentage of persons aged ≥5
years who speak English “less than well,” 11) percentage of housing in structures
with ≥10 units (multiunit housing), 12) percentage of housing structures that are
mobile homes, 13) percentage households with more persons than rooms (crowding), 14)
percentage of households with no vehicle available, and 15) percentage of persons
in group quarters. Estimates are created using 2014–2018 (5-year) data from the American
Community Survey. The 15 indicators are categorized into four themes: 1) socioeconomic
status (indicators 1–4), 2) household composition and disability (indicators 5–8),
3) racial/ethnic minority status and language (indicators 9 and 10), and 4) housing
type and transportation (indicators 11–15). Overall SVI includes all 15 indicators
as a composite measure.
This figure is a bar chart showing the distribution of COVID-19 vaccination coverage
among persons who received at least one dose during December 14, 2020–March 1, 2021,
for U.S. counties with low, moderate, and high social vulnerability according to 15
social vulnerability index indicators.
In the state-level analyses, across overall SVI and all four themes, higher vaccination
coverage in high vulnerability counties compared with low vulnerability counties (i.e.,
equity) was found in two states (Arizona and Montana) (Figure 2) (Supplementary Table,
Supplementary Figure 2, https://stacks.cdc.gov/view/cdc/104111). Three other states
had higher vaccination coverage in high vulnerability counties than in low vulnerability
counties for the overall SVI and three of four themes (Alaska, all except the socioeconomic
status theme, and Minnesota and West Virginia, all except the racial/ethnic minority
status and language theme). Vaccination disparities were observed in 31 states (overall
SVI measure); in 11 of these states, the disparity was found in all four SVI themes.
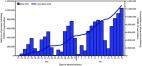
FIGURE 2
Distribution of county-level* COVID-19 vaccination coverage among persons who received
at least one vaccine dose (N = 49,019,117),
†
by state and overall social vulnerability index (SVI) tertile — United States, December
14, 2020–March 1, 2021
* Counties were assigned to tertiles (low, moderate, and high) for overall SVI. Data
are presented as a 100% stacked bar chart (normalized across states), with the length
of each bar segment representing the proportion of total vaccination coverage for
each SVI tertile. When proportions of vaccination coverage are equal among SVI tertiles,
each proportion represents 0.33, represented by the vertical lines. When proportions
of vaccination coverage estimates are not equally distributed among SVI tertiles,
then proportions do not align with threshold lines representing 0.33.
† Vaccines administered to residents of 48 U.S. states (excluding Delaware, the District
of Columbia, and Hawaii) during December 14, 2020–March 1, 2021, and reported to CDC
by March 6, 2021.
This figure is a bar chart showing the distribution of COVID-19 vaccination coverage
among persons who received at least one dose, by state, during December 14, 2020–March
1, 2021, for U.S. counties with low, moderate, and high social vulnerability according
to the social vulnerability index.
Discussion
Ensuring equitable COVID-19 vaccine access is a priority for the U.S. COVID-19 vaccination
program.**** In the first 2.5 months of the program, vaccination coverage was lower
in high vulnerability counties nationwide, demonstrating that additional efforts are
needed to achieve equity in vaccination coverage for those who have been most affected
by COVID-19 (
3
). Improving COVID-19 vaccination coverage in communities with high proportions of
racial/ethnic minority groups and persons who are economically and socially marginalized
is critical because these populations have been disproportionately affected by COVID-19–related
morbidity and mortality (
4
–
6
). Monitoring community-level metrics is essential to informing tailored, local vaccine
delivery efforts, which might reduce inequities. Public health officials can investigate
whether disparities are occurring because of access problems (e.g., vaccine supply, vaccination
clinic availability, and lack of prioritization of vulnerable groups) or other challenges,
such as vaccine hesitancy. Vaccination promotion, outreach, and administration might
focus on high vulnerability populations within counties (e.g., providing resources
to federally qualified health centers when socioeconomic disparities are identified).
††††
Vaccination coverage was consistently lower in high vulnerability counties than in
low vulnerability counties for the socioeconomic status indicators (i.e., poverty,
unemployment, low income, and no high school diploma); the coverage disparity was
largest for the education indicator. However, equal vaccination coverage in counties
with low and high social vulnerability was observed for the indicators relating to
the percentages of persons who speak English less than well and with persons with
a disability, which is encouraging in light of the disproportionate incidence of COVID-19
in these populations.
§§§§
Higher coverage in counties with large proportions of older adults was consistent
with the prioritization of this age group early in the vaccination program; however,
the higher coverage in counties with lower percentages of households with a vehicle
available was unexpected and warrants further investigation. Despite these positive
findings, equity in access to COVID-19 vaccination has not been achieved nationwide.
COVID-19 vaccination equity varied among states. In most states, coverage was higher
in low vulnerability counties than in high vulnerability counties. Despite this, states
such as Arizona and Montana achieved higher vaccination coverage in high vulnerability
counties across SVI metrics. Practices in states with high equity included 1) prioritizing
persons in racial/ethnic minority groups during the early stages of the vaccine program
implementation, 2) actively monitoring and addressing barriers to vaccination in vulnerable
communities, 3) directing vaccines to vulnerable communities, 4) offering free transportation
to vaccination sites, and 5) collaborating with community partners, tribal health
organizations, and the Indian Health Service.
¶¶¶¶
More investigation is needed to understand these differences to identify best practices
to achieve COVID-19 vaccination equity.
These findings demonstrate that estimates for overall SVI obscured variations among
SVI themes and that SVI themes masked variations among indicators within a theme group.
In addition, the national coverage estimates by SVI metrics did not capture the wide
variation among states. These results highlight the importance of examining individual
SVI indicators in addition to the composite SVI measure and themes to monitor equitable
vaccine administration. State and local jurisdictions should also consider analyzing
SVI metrics at the level of the census tract (when these data are available).
The findings in this report are subject to at least five limitations. First, because
specific populations were prioritized for vaccination in each state, the differences
observed might be due, in part, to prioritization based on age, occupational exposures,
and underlying health conditions. Second, these associations are ecological and reported
for population-based metrics rather than individual-level vulnerability data. With
only age, sex, and limited race/ethnicity data available at the national level, use
of these population-based metrics is an important method to evaluate socioeconomic
and demographic disparities. Third, although the geographic unit of analysis was the
county, the vulnerabilities and vaccination coverage rates might vary within counties;
state and local jurisdictions might prioritize vaccination efforts for high vulnerability
communities in smaller geographic units (e.g., census tracts). Fourth, SVI metrics
do not include all population characteristics that could be used to identify disparities
and focus vaccination efforts, such as lack of Internet access (
7
). Finally, coverage was calculated based on total population, and vaccines authorized
for use during the study period were only recommended for persons aged ≥16 or ≥18
years.*****
The results of this study indicate that COVID-19 vaccination coverage was lower in
high vulnerability counties than in low vulnerability counties, a finding largely
driven by socioeconomic disparities. As vaccine supply increases and administration
expands to additional priority groups, CDC, state, and local jurisdictions should
continue to monitor vaccination levels by SVI metrics to aid in the development of
community efforts to improve vaccination access, outreach, and administration among
populations most affected by COVID-19.
Summary
What is already known about this topic?
COVID-19 has disproportionally affected racial/ethnic minority groups and persons
who are economically and socially disadvantaged. Ensuring equitable COVID-19 vaccine
coverage is a national priority.
What is added by this report?
In the first 2.5 months of the U.S. vaccination program, high social vulnerability
counties had lower COVID-19 vaccination coverage than did low social vulnerability
counties. Although vaccination coverage estimates by county-level social vulnerability
varied widely among states, disparities in vaccination coverage were observed in the
majority of states.
What are the implications for public health practice?
Continued monitoring of vaccination coverage by social vulnerability metrics is critical for
developing tailored, local vaccine administration and outreach efforts to reduce COVID-19
vaccination inequities.
Related collections
Most cited references5
- Record: found
- Abstract: not found
- Article: not found
Racial and Ethnic Health Disparities Related to COVID-19
Leo Lopez, Louis H. Hart, Mitchell Katz (2021)
- Record: found
- Abstract: found
- Article: not found
Social Vulnerability and Racial Inequality in COVID-19 Deaths in Chicago
Sage Kim, Wendy Bostwick (2020)
- Record: found
- Abstract: found
- Article: found
Demographic Characteristics of Persons Vaccinated During the First Month of the COVID-19 Vaccination Program — United States, December 14, 2020–January 14, 2021
Elizabeth M. Painter, Emily Ussery, Anita Patel … (2021)