- Record: found
- Abstract: found
- Article: found
Body Mass Index and Risk for COVID-19–Related Hospitalization, Intensive Care Unit Admission, Invasive Mechanical Ventilation, and Death — United States, March–December 2020
research-article
Lyudmyla Kompaniyets , PhD
1
,
2
,
,
Alyson B. Goodman , MD
1 ,
Brook Belay , MD
1
,
2 ,
David S. Freedman , PhD
1 ,
Marissa S. Sucosky , MPH
1 ,
Samantha J. Lange , MPH
1 ,
Adi V. Gundlapalli , MD, PhD
2 ,
Tegan K. Boehmer , PhD
2 ,
Heidi M. Blanck , PhD
1
12 March 2021
Read this article at
There is no author summary for this article yet. Authors can add summaries to their articles on ScienceOpen to make them more accessible to a non-specialist audience.
Abstract
Obesity* is a recognized risk factor for severe COVID-19 (
1
,
2
), possibly related to chronic inflammation that disrupts immune and thrombogenic
responses to pathogens (
3
) as well as to impaired lung function from excess weight (
4
). Obesity is a common metabolic disease, affecting 42.4% of U.S. adults (
5
), and is a risk factor for other chronic diseases, including type 2 diabetes, heart
disease, and some cancers.
†
The Advisory Committee on Immunization Practices considers obesity to be a high-risk
medical condition for COVID-19 vaccine prioritization (
6
). Using data from the Premier Healthcare Database Special COVID-19 Release (PHD-SR),
§
CDC assessed the association between body mass index (BMI) and risk for severe COVID-19
outcomes (i.e., hospitalization, intensive care unit [ICU] or stepdown unit admission,
invasive mechanical ventilation, and death). Among 148,494 adults who received a COVID-19
diagnosis during an emergency department (ED) or inpatient visit at 238 U.S. hospitals
during March–December 2020, 28.3% had overweight and 50.8% had obesity. Overweight
and obesity were risk factors for invasive mechanical ventilation, and obesity was
a risk factor for hospitalization and death, particularly among adults aged <65 years.
Risks for hospitalization, ICU admission, and death were lowest among patients with
BMIs of 24.2 kg/m2, 25.9 kg/m2, and 23.7 kg/m2, respectively, and then increased sharply
with higher BMIs. Risk for invasive mechanical ventilation increased over the full
range of BMIs, from 15 kg/m2 to 60 kg/m2. As clinicians develop care plans for COVID-19
patients, they should consider the risk for severe outcomes in patients with higher
BMIs, especially for those with severe obesity. These findings highlight the clinical
and public health implications of higher BMIs, including the need for intensive COVID-19
illness management as obesity severity increases, promotion of COVID-19 prevention
strategies including continued vaccine prioritization (
6
) and masking, and policies to ensure community access to nutrition and physical activities
that promote and support a healthy BMI.
Data for this study were obtained from PHD-SR, a large, hospital-based, all-payer
database. Among the approximately 800 geographically dispersed U.S. hospitals that
reported both inpatient and ED data to this database, 238 reported patient height
and weight information and were selected for this study. The sample included patients
aged ≥18 years with measured height and weight and an ED or inpatient encounter with
an International Classification of Diseases, Tenth Revision, Clinical Modification
(ICD-10-CM) code of U07.1 (COVID-19, virus identified) during April 1–December 31,
2020, or B97.29 (other coronavirus as the cause of diseases classified elsewhere;
recommended before April 2020 release of U07.1) during March 1–April 30, 2020.
¶
BMI was calculated using heights and weights measured during the health care encounter
closest to the patient’s ED or hospital encounter for COVID-19 in the database.**
BMI was classified into the following categories: underweight (<18.5 kg/m2), healthy
weight (18.5–24.9 kg/m2 [reference]), overweight (25–29.9 kg/m2), and obesity (four
categories: 30–34.9 kg/m2, 35–39.9 kg/m2, 40–44.9 kg/m2, and ≥45 kg/m2).
Frequencies and percentages were used to describe the patient sample. Multivariable
logit models were used to estimate adjusted risk ratios (aRRs) between BMI categories
and four outcomes of interest: hospitalization (reference = ED patients not hospitalized)
and ICU admission, invasive mechanical ventilation, and death among hospitalized patients
(reference = hospitalized patients without the outcome and who did not die).
††
Analyses were then stratified by age (<65 years versus ≥65 years). Multivariable logit
models were used to estimate risks for the outcomes of interest based on continuous
BMI (modeled as fractional polynomials to account for nonlinear associations) (
7
).
§§
Risks were reestimated for different age categories, after including interactions
between age category and BMI.
Models used robust standard errors clustered on hospital identification and included
age,
¶¶
sex, race/ethnicity, payer type, hospital urbanicity, hospital U.S. Census region,
and admission month as control variables. Models did not adjust for other underlying
medical conditions known to be risk factors for COVID-19,*** because most of these
conditions represent intermediate variables on a causal pathway from exposure (i.e.,
BMI) to outcome. A sensitivity analysis adjusting for these conditions was performed.
†††
A second sensitivity analysis used multiple imputation for missing BMIs. Analyses
were conducted using R software (version 4.0.3; The R Foundation) and Stata (version
15.1, StataCorp). This activity was reviewed by CDC and conducted consistent with
applicable federal law and CDC policy.
§§§
Among 3,242,649 patients aged ≥18 years with documented height and weight who received
ED or inpatient care in 2020, a total of 148,494 (4.6%) had ICD-10-CM codes indicating
a diagnosis of COVID-19 (Table). Among 71,491 patients hospitalized with COVID-19
(48.1% of all COVID-19 patients), 34,896 (48.8%) required ICU admission, 9,525 (13.3%)
required invasive mechanical ventilation, and 8,348 (11.7%) died. Approximately 1.8%
of patients had underweight, 28.3% had overweight, and 50.8% had obesity. Compared
with the total PHD-SR cohort, patients with COVID-19–associated illness were older
(median age of 55 years versus 49 years) and had a higher crude prevalence of obesity
(50.8% versus 43.1%).
TABLE
Characteristics of patients aged ≥18 years with a COVID-19–related emergency department
or inpatient hospital visit — Premier Healthcare Database Special COVID-19 Release
(PHD-SR),* United States, March–December 2020
Characteristic†
No. (%)§
Total cohort in database
Patients with COVID-19
Total cohort
Hospitalized
Hospitalized, ICU care
Hospitalized, IMV
Hospitalized, died
Total
3,242,649 (100.0)
148,494 (100.0)
71,491 (100.0)
34,896 (100.0)
9,525 (100.0)
8,348 (100.0)
Sex
Female
1,852,609 (57.1)
79,624 (53.6)
35,253 (49.3)
15,601 (44.7)
3,818 (40.1)
3,468 (41.5)
Male
1,390,040 (42.9)
68,870 (46.4)
36,238 (50.7)
19,295 (55.3)
5,707 (59.9)
4,880 (58.5)
Age, yrs, median (IQR)
49 (32–66)
55 (38–70)
65 (52–77)
66 (54–77)
67 (57–76)
74 (65–83)
Age group, yrs
18–39
1,230,684 (38.0)
39,545 (26.6)
8,979 (12.6)
2,907 (8.3)
525 (5.5)
126 (1.5)
40–49
431,355 (13.3)
20,638 (13.9)
6,869 (9.6)
3,258 (9.3)
761 (8.0)
277 (3.3)
50–64
703,229 (21.7)
37,877 (25.5)
19,059 (26.7)
9,784 (28.0)
2,855 (30.0)
1,555 (18.6)
65–74
422,407 (13.0)
23,158 (15.6)
15,406 (21.5)
8,291 (23.8)
2,683 (28.2)
2,221 (26.6)
≥75
454,974 (14.0)
27,276 (18.4)
21,178 (29.6)
10,656 (30.5)
2,701 (28.4)
4,169 (49.9)
Race/Ethnicity
Hispanic or Latino
337,234 (10.4)
29,576 (19.9)
12,303 (17.2)
6,197 (17.8)
1,619 (17.0)
1,244 (14.9)
White, non-Hispanic
2,064,343 (63.7)
75,659 (51.0)
40,292 (56.4)
19,413 (55.6)
5,256 (55.2)
5,167 (61.9)
Black, non-Hispanic
597,909 (18.4)
30,306 (20.4)
12,735 (17.8)
6,377 (18.3)
1,697 (17.8)
1,261 (15.1)
Asian, non-Hispanic
67,286 (2.1)
3,536 (2.4)
1,662 (2.3)
668 (1.9)
231 (2.4)
159 (1.9)
Other
130,723 (4.0)
6,729 (4.5)
3,252 (4.5)
1,619 (4.6)
516 (5.4)
353 (4.2)
Unknown
45,154 (1.4)
2,688 (1.8)
1,247 (1.7)
622 (1.8)
206 (2.2)
164 (2.0)
Payer type
Commercial
1,002,345 (30.9)
49,366 (33.2)
17,543 (24.5)
8,130 (23.3)
1,935 (20.3)
887 (10.6)
Medicare
997,984 (30.8)
55,598 (37.4)
38,598 (54.0)
19,901 (57.0)
5,661 (59.4)
6,380 (76.4)
Medicaid
640,338 (19.7)
22,213 (15.0)
8,358 (11.7)
3,278 (9.4)
1,021 (10.7)
540 (6.5)
Charity/Indigent/Self-Pay
416,485 (12.8)
7,179 (4.8)
2,246 (3.1)
1,086 (3.1)
254 (2.7)
130 (1.6)
Other/Unknown
185,497 (5.7)
14,138 (9.5)
4,746 (6.6)
2,501 (7.2)
654 (6.9)
411 (4.9)
Body mass index (kg/m2)
<18.5 (underweight)
79,988 (2.5)
2,674 (1.8)
1,730 (2.4)
865 (2.5)
169 (1.8)
273 (3.3)
18.5–24.9 (healthy weight)
829,474 (25.6)
28,349 (19.1)
14,111 (19.7)
6,891 (19.7)
1,550 (16.3)
1,957 (23.4)
25–29.9 (overweight)
936,132 (28.9)
41,973 (28.3)
19,847 (27.8)
9,661 (27.7)
2,435 (25.6)
2,277 (27.3)
≥30 (obesity)
1,397,055 (43.1)
75,498 (50.8)
35,803 (50.2)
17,479 (50.1)
5,371 (56.3)
3,841 (46.0)
30–34.9
674,575 (20.8)
34,608 (23.3)
16,338 (22.9)
7,883 (22.6)
2,300 (24.1)
1,830 (21.9)
35–39.9
373,226 (11.5)
20,262 (13.6)
9,476 (13.3)
4,601 (13.2)
1,399 (14.7)
960 (11.5)
40–44.9 (severe obesity)
187,046 (5.8)
10,739 (7.2)
5,015 (7.0)
2,438 (7.0)
783 (8.2)
517 (6.2)
≥45 (severe obesity)
162,208 (5.0)
9,889 (6.7)
4,974 (7.0)
2,557 (7.3)
889 (9.3)
534 (6.4)
Hospital U.S. Census region¶
Midwest
683,575 (21.1)
33,800 (22.8)
16,305 (22.8)
6,907 (19.8)
2,279 (23.9)
1,795 (21.5)
Northeast
476,367 (14.7)
18,276 (12.3)
10,758 (15.0)
3,641 (10.4)
1,557 (16.3)
1,639 (19.6)
South
1,988,506 (61.3)
94,555 (63.7)
43,616 (61.0)
23,955 (68.6)
5,567 (58.4)
4,812 (57.6)
West
94,201 (2.9)
1,863 (1.3)
812 (1.1)
393 (1.1)
122 (1.3)
102 (1.2)
Abbreviations: ICU = intensive care or stepdown unit; IMV = invasive mechanical ventilation;
IQR = interquartile range.
* Data in PHD-SR, formerly known as the PHD COVID-19 Database, are released every
2 weeks; release date March 2, 2021, access date March 3, 2021. http://offers.premierinc.com/rs/381-NBB-525/images/PHD_COVID-19_White_Paper.pdf
† Categories might not sum to 100% because of rounding or because they are not mutually
exclusive.
§ Columns are not mutually exclusive.
¶
Northeast: Connecticut, Maine, Massachusetts, New Hampshire, New Jersey, New York,
Pennsylvania, Rhode Island, Vermont; Midwest: Illinois, Indiana, Iowa, Kansas, Michigan,
Minnesota, Missouri, Nebraska, North Dakota, Ohio, South Dakota, Wisconsin; South:
Alabama, Arkansas, Delaware, District of Columbia, Florida, Georgia, Kentucky, Louisiana,
Maryland, Mississippi, North Carolina, Oklahoma, South Carolina, Tennessee, Texas,
Virginia, West Virginia; West: Alaska, Arizona, California, Colorado, Hawaii, Idaho,
Montana, Nevada, New Mexico, Oregon, Utah, Washington, and Wyoming.
Obesity was a risk factor for both hospitalization and death, exhibiting a dose-response
relationship with increasing BMI category: aRRs for hospitalization ranged from 1.07
(95% confidence interval [CI = 1.05–1.09]) for patients with a BMI of 30–34.9 kg/m2
to 1.33 (95% CI = 1.30–1.37) for patients with a BMI ≥45 kg/m2 (Figure 1) compared
with those with a BMI of 18.5–24.9 kg/m2 (healthy weight); aRRs for death ranged from
1.08 (95% CI = 1.02–1.14) for those with a BMI of 30–34.9 kg/m2 to 1.61 (95% CI =
1.47–1.76) for those with a BMI ≥45 kg/m2. Severe obesity was associated with ICU
admission, with aRRs of 1.06 (95% CI = 1.03–1.10) for patients with a BMI of 40–44.9
kg/m2 and 1.16 (95% CI = 1.11–1.20) for those with a BMI ≥45 kg/m2. Overweight and
obesity were risk factors for invasive mechanical ventilation, with aRRs ranging from
1.12 (95% CI = 1.05–1.19) for a BMI of 25–29.9 kg/m2 to 2.08 (95% CI = 1.89–2.29)
for a BMI ≥45 kg/m2. Associations with risk for hospitalization and death were pronounced
among adults aged <65 years: aRRs for patients in the highest BMI category (≥45 kg/m2)
compared with patients with healthy weights were 1.59 (95% CI = 1.52–1.67) for hospitalization
and 2.01 (95% CI = 1.72–2.35) for death.
FIGURE 1
Association between body mass index (BMI) and severe COVID-19–associated illness*
among adults aged ≥18 years, by age group — Premier Healthcare Special COVID-19 Release
(PHD-SR),
†
United States, March–December 2020
§
Abbreviations: aRR = adjusted risk ratio; ICU = intensive care or stepdown unit; IMV
= invasive mechanical ventilation.
* Illness requiring hospitalization, ICU admission, or IMV or resulting in death.
† Data in PHD-SR, formerly known as the PHD COVID-19 Database, are released every
2 weeks; release date March 2, 2021, access date March 3, 2021. http://offers.premierinc.com/rs/381-NBB-525/images/PHD_COVID-19_White_Paper.pdf
§ Each panel contains the results of a single logit model, adjusted for BMI category,
age, sex, race/ethnicity, payer type, hospital urbanicity, hospital U.S. Census region,
and admission month as control variables. Age group (18–39 [reference], 40–49, 50–64,
65–74, and ≥75 yrs) was used as a control variable in the models that included patients
of all ages (first four panels), whereas continuous age as cubic polynomial was used
as a control variable in models stratified by age (<65 and ≥65 yrs). Risk for hospitalization
was estimated in the full sample; risk for ICU admission, IMV, and death were estimated
in the hospitalized sample. Patients who died without requiring ICU admission or IMV
were excluded from the sample when estimating the model with outcome of ICU admission
or IMV, respectively.
This figure is a chart of adjusted risk ratios indicating the association between
body mass index and the risk for hospitalization, intensive care unit admission, invasive
mechanical ventilation, and death among adults aged ≥18 years with COVID-19–associated
illness, by age group.
Patients with COVID-19 with underweight had a 20% (95% CI = 16%–25%) higher risk for
hospitalization than did those with a healthy weight. Patients aged <65 years with
underweight were 41% (95% CI = 31%–52%) more likely to be hospitalized than were those
with a healthy weight, and patients aged ≥65 years with underweight were 7% (95% CI
= 4%–10%) more likely to be hospitalized.
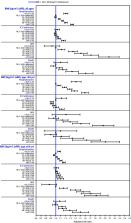
A J-shaped (nonlinear) relationship was observed between continuous BMI and risk for
three outcomes. Risk for hospitalization, ICU admission, and death were lowest at
BMIs of 24.2 kg/m2, 25.9 kg/m2, and 23.7 kg/m2, respectively, and then increased sharply
with higher BMIs (Figure 2). Estimated risk for invasive mechanical ventilation increased
over the full range of BMIs, from 15 kg/m2 to 60 kg/m2. Estimated risks for hospitalization
and death were consistently higher for older age groups; however, within each age
group, risk increased with higher BMIs.
FIGURE 2
Estimated risk for severe COVID-19–associated illness
*
among adults aged ≥18 years, by body mass index (BMI) and age group — Premier Healthcare
Special COVID-19 Release (PHD-SR),
†
United States, March–December, 2020
§
Abbreviations: ICU = intensive care or stepdown unit; IMV = invasive mechanical ventilation.
* Illness requiring hospitalization, ICU admission, or IMV or resulting in death.
† Data in PHD-SR, formerly known as the PHD COVID-19 Database, are released every
2 weeks; release date March 2, 2021, access date March 3, 2021. http://offers.premierinc.com/rs/381-NBB-525/images/PHD_
COVID-19_White_Paper.pdf
§ Each panel contains the results of a single logit model, adjusted for BMI (as fractional
polynomials), age group (18–39 [reference], 40–49, 50–64, 65–74, and ≥75 yrs), sex,
race/ethnicity, payer type, hospital urbanicity, hospital U.S. Census region, and
admission month as control variables. Confidence intervals are shown by error bars.
The bottom panels also include interactions between BMI (as fractional polynomials)
and age group. Risk for hospitalization was estimated in the full sample; risk for
ICU admission, IMV, and death were estimated in the hospitalized sample. Patients
who died without requiring ICU admission or IMV were excluded from the sample when
estimating the model with outcome of ICU admission or IMV, respectively. The best
fitting models included the following fractional polynomials of BMI: BMI-2 and BMI-0.5
for hospitalization outcome, BMI0.5 and BMI0.5
*ln(BMI) for ICU admission outcome, BMI2 and BMI2
*ln(BMI) for IMV outcome, and BMI-0.5 and ln(BMI) for death outcome.
This figure is a collection of eight charts showing the association between body mass
index (BMI) and risk for hospitalization, intensive care unit admission, invasive
mechanical ventilation, and death among adults aged ≥18 years with COVID-19–associated
illness, by BMI and age group.
A sensitivity analysis showed weaker associations between BMI category and severe
COVID-19–associated illness when adjusted for other underlying medical conditions,
particularly among patients aged ≥65 years (Supplementary Figure 1, https://stacks.cdc.gov/view/cdc/103732).
Results of a second sensitivity analysis using multiple imputation for missing BMIs
were consistent with the primary results (Supplementary Table and Supplementary Figure
2, https://stacks.cdc.gov/view/cdc/103732).
Discussion
One half (50.8%) of adult COVID-19 patients in this analysis had obesity, compared
with 43.1% in the total PHD-SR sample and 42.4% nationally (
5
), suggesting that adults with COVID-19–associated illness and obesity might commonly
receive acute care in EDs or hospitals. The findings in this report are similar to
those from previous studies that indicate an increased risk for severe COVID-19–associated
illness among persons with excess weight and provide additional information about
a dose-response relationship between higher BMI and risk for hospitalization, ICU
admission, invasive mechanical ventilation, and death (
1
,
2
). The finding that risk for severe COVID-19–associated illness increases with higher
BMI suggests that progressively intensive management of COVID-19 might be needed for
patients with more severe obesity. This finding also supports the hypothesis that
inflammation from excess adiposity might be a factor in the severity of COVID-19–associated
illness (
3
,
8
). The positive association found between underweight and hospitalization risk could
be explained by uncaptured underlying medical conditions or impairments in essential
nutrient availability and immune response (
9
).
Consistent with previous studies, the dose-response relationship between risk for
hospitalization or death and higher BMI was particularly pronounced among patients
aged <65 years (
1
,
2
). However, in contrast to previous studies that demonstrated little or no association
between obesity and COVID-19 severity among older patients (
1
,
2
), the results in this report indicate that overweight and obesity are risk factors
for invasive mechanical ventilation and that obesity or severe obesity are risk factors
for hospitalization, ICU admission, and death among patients aged ≥65 years. A sensitivity
analysis adjusting for other underlying medical conditions found weaker associations
between BMI and severe COVID-19–associated illness, which might be partially attributable
to indirect effects of obesity on COVID-19 or overadjustment by including intermediate
variables on the causal pathway from exposure (i.e., BMI) to outcome.
BMI is continuous in nature, and the analyses in this report describe a J-shaped association
between BMI and severe COVID-19, with the lowest risk at BMIs near the threshold between
healthy weight and overweight in most instances. Risk for invasive mechanical ventilation
increased over the full range of BMIs, possibly because of impaired lung function
associated with higher BMI (
4
). These results highlight the need to promote and support a healthy BMI, which might
be especially important for populations disproportionately affected by obesity, particularly
Hispanic or Latino and non-Hispanic Black adults and persons from low-income households,
which are populations who have a higher prevalence of obesity and are more likely
to have worse outcomes from COVID-19 compared with other populations.
¶¶¶
The findings in this study are subject to at least five limitations. First, risk estimates
for severe COVID-19–associated illness (including hospitalization) were measured only
among adults who received care at a hospital; therefore, these estimates might differ
from the risk among all adults with COVID-19. Second, hospitalization risk estimates
might have been affected by bias introduced by hospital admission factors other than
COVID-19 severity, such as a health care professional’s anticipation of future severity.
Third, only patients with reported height and weight information were included; among
238 hospitals, 28% of patients were missing height information, weight information,
or both. However, results of a sensitivity analysis using multiple imputation for
missing BMIs were consistent with the primary findings. Fourth, the BMI of some older
adults might have been misclassified because of complex interactions between height
loss and sarcopenia, a condition characterized by loss of skeletal muscle mass and
function (
10
). Finally, although this analysis includes one of the largest samples of patients
with available heights and weights to be assessed to date, the results are not representative
of the entire U.S. patient population.
The findings in this report highlight a dose-response relationship between higher
BMI and severe COVID-19–associated illness and underscore the need for progressively
intensive illness management as obesity severity increases. Continued strategies are
needed to ensure community access to nutrition and physical activity opportunities
that promote and support a healthy BMI. Preventing COVID-19 in adults with higher
BMIs and their close contacts remains important and includes multifaceted protection
measures such as masking, as well as continued vaccine prioritization (
6
) and outreach for this population.
Summary
What is already known about this topic?
Obesity increases the risk for severe COVID-19–associated illness.
What is added by this report?
Among 148,494 U.S. adults with COVID-19, a nonlinear relationship was found between
body mass index (BMI) and COVID-19 severity, with lowest risks at BMIs near the threshold
between healthy weight and overweight in most instances, then increasing with higher
BMI. Overweight and obesity were risk factors for invasive mechanical ventilation.
Obesity was a risk factor for hospitalization and death, particularly among adults
aged <65 years.
What are the implications for public health practice?
These findings highlight clinical and public health implications of higher BMIs, including
the need for intensive management of COVID-19–associated illness, continued vaccine
prioritization and masking, and policies to support healthy behaviors.
Related collections
Most cited references11

- Record: found
- Abstract: found
- Article: found
Individuals with obesity and COVID‐19: A global perspective on the epidemiology and biological relationships
Barry M. Popkin, Shufa Du, William D. Green … (2020)
- Record: found
- Abstract: found
- Article: not found
Prevalence of Obesity and Severe Obesity Among Adults: United States, 2017-2018.
Craig Hales, Margaret Carroll, Cheryl D Fryar … (2020)
- Record: found
- Abstract: found
- Article: not found
Obesity and Mortality Among Patients Diagnosed With COVID-19: Results From an Integrated Health Care Organization
Sara Tartof, Lei Qian, Vennis Hong … (2020)