- Record: found
- Abstract: found
- Article: found
E-cigarette Unit Sales, by Product and Flavor Type — United States, 2014–2020
research-article
Fatma Romeh M. Ali , PhD
1
,
,
Megan C. Diaz , PhD
2 ,
Donna Vallone , PhD
2 ,
Michael A. Tynan
3 ,
Jamie Cordova , MPH
1 ,
Elizabeth L. Seaman , PhD
1 ,
Katrina F. Trivers , PhD
3 ,
Barbara A. Schillo , PhD
2 ,
Brandon Talley , MPH
1 ,
Brian A. King , PhD
3
18 September 2020
Read this article at
There is no author summary for this article yet. Authors can add summaries to their articles on ScienceOpen to make them more accessible to a non-specialist audience.
Abstract
Since electronic cigarettes (e-cigarettes) entered the U.S. marketplace in 2007, the
landscape has evolved to include different product types (e.g., prefilled cartridge–based
and disposable products) and flavored e-liquids (e.g., fruit, candy, mint, menthol,
and tobacco flavors), which have contributed to increases in youth use (
1
,
2
). E-cigarettes have been the most commonly used tobacco product among U.S. youths
since 2014; in 2019, 27.5% of high school students reported current e-cigarette use
(
3
). To assess trends in unit sales of e-cigarettes in the United States by product
and flavor type, CDC, CDC Foundation, and Truth Initiative analyzed retail scanner
data during September 14, 2014–May 17, 2020, from Information Resources, Inc. (IRI).
During this period, total e-cigarette sales increased by 122.2%, from 7.7 million
to 17.1 million units per 4-week interval. By product type, the proportion of total
sales that was prefilled cartridge products increased during September 2014–August
2019 (47.5% to 89.4%). During August 2019–May 2020, the proportion of total sales
that was disposable products increased from 10.3% to 19.8%, while the proportion that
was prefilled cartridge products decreased (89.4% to 80.2%). Among prefilled cartridge
sales, the proportion of mint sales increased during September 2014–August 2019 (<0.1%
to 47.6%); during August 2019–May 2020, mint sales decreased (47.6% to 0.3%), as menthol
sales increased (10.7% to 61.8%). Among disposable e-cigarette sales during September
2014–May 2020, the proportion of mint sales increased (<0.1% to 10.5%), although tobacco-flavored
(52.2% to 17.2%) and menthol-flavored (30.3% to 10.2%) sales decreased; during the
same period, sales of all other flavors combined increased (17.2% to 62.1%). E-cigarette
sales increased during 2014–2020, but fluctuations occurred overall and by product
and flavor type, which could be attributed to consumer preferences and accessibility.
Continued monitoring of e-cigarette sales and use is critical to inform strategies
at the national, state, and community levels to minimize the risks of e-cigarettes
on individual- and population-level health. As part of a comprehensive approach to
prevent and reduce youth e-cigarettes use, such strategies could include those that
address youth-appealing product innovations and flavors.
Retail sales data were licensed from IRI, Inc., which included Universal Product Code
sales from convenience stores, gas stations, grocery stores, drugstores/pharmacies,
mass merchandiser outlets, club stores, dollar stores, and military sales. Sales from
the Internet and tobacco-specialty stores, including “vape shops,” were not included.
E-cigarette products were categorized as one of the following product types: prefilled
cartridge devices, disposable devices, and e-liquids.* E-cigarette accessories and
devices sold without e-liquids, which accounted for 9.4% of sales, were excluded.
Products with explicit flavor names were categorized as tobacco, menthol, mint, or
all other flavors (e.g., fruit, clove/spice, candy/desserts/other sweets, chocolate,
alcoholic and nonalcoholic drinks). Ambiguous or concept flavors (e.g., “fusion”)
(5.6%) were searched for online and back-coded into one of the four flavor categories.
E-cigarette unit sales were standardized and aggregated in 4-week intervals from September
14, 2014, through May 17, 2020
†
(
4
). Analyses were performed for total unit sales and the proportion of total unit sales
by product type and flavor using Stata (version16; StataCorp). Trends during 2014–2020
were analyzed using Joinpoint (version 4.8.0.1; National Cancer Institute), and average
4-week interval percentage change (AIPC) with corresponding 95% confidence intervals
(CIs) were calculated. Statistical significance was defined as p<0.05. This study
did not involve human subjects, and thus, was not submitted for Institutional Review
Board review.
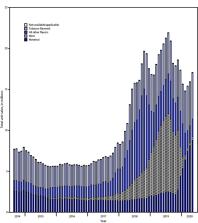
During September 2014–May 2020, total unit sales increased by 122.2% (p<0.05), from
7.7 million to 17.1 million units per 4-week interval. (AIPC = 1.1; 95% CI = 0.6 to
1.6); however, within the context of this general increase, sales fluctuated (Figure
1). During November 2016–August 2019, sales increased by 294.3%, from 5.6 million
to 22.0 million units per period (AIPC = 4.1; 95% CI = 3.2 to 5.1) (p<0.05). During
August 2019–February 2020, sales decreased 32.7%, from 22.0 million to 14.8 million
units per period (AIPC = −5.1; 95% CI = −7.2 to −2.8) (p<0.05). No significant change
in total sales occurred during February–May 2020.
FIGURE 1
Total e-cigarette unit sales,* by flavor
†
— United States, September 14, 2014–May 17, 2020
§
* Retail sales data were obtained from Information Resources, Inc. (IRI) for convenience
stores, gas stations, grocery stores, drugstores/pharmacies, mass merchandiser outlets,
club stores, dollar stores, and military sales; data from the Internet and vape shops
were not collected.
† The “All other flavors” category includes fruit, clove/spice, chocolate, alcoholic
drink (such as wine, cognac, or other cocktails), candy/desserts/other sweets, or
some other flavor. Unknown flavors were excluded from this figure (<0.1%).
§ Each bar in the figure represents a 4-week aggregate interval.
The figure is a bar chart showing total e-cigarette unit sales, by flavor, in the
United States during September 14, 2014–May 17, 2020.
Among total e-cigarette unit sales during September 2014–August 2019, the proportion
that were prefilled cartridges increased from 47.5% to 89.4% (AIPC = 1.0) (p<0.05)
(Table). The proportion of total sales that were prefilled cartridges decreased thereafter
(p<0.05), accounting for 80.2% of total sales in May 2020 (AIPC = −1.3). As the proportion
of sales accounted for by prefilled cartridges decreased beginning August 2019, the
proportion of sales that were disposable products increased from 10.3% of total sales
in August 2019 to 19.8% in May 2020 (AIPC = 7.5) (p<0.05).
TABLE
Trends in e-cigarette unit sales, by product and flavor type — United States, September
14, 2014–May 17, 2020
Sales type*
Period
AIPC (95% CI)†
Total sales, by product type
Prefilled cartridges§
September 2014–August 2019
1.0 (0.8 to 1.2)
August 2019–May 2020
−1.3 (−1.9 to −0.6)
Disposable devices¶
September 2014–August 2019
−2.4 (−3.1 to −1.6)
August 2019–May 2020
7.5 (4.6 to 10.5)
E-liquid**
September 2014–May 2020
−5.8 (−7.0 to −4.5)
Total sales, by flavor type
Mint
September 2014–August 2019
10.5 (8.1 to 13.0)
August 2019–May 2020
−28.3 (−36.9 to −18.5)
Menthol
August 2019–May 2020
18.9 (12.5 to 25.7)
Tobacco
August 2019–May 2020
4.6 (2.7 to 6.6)
All other flavors † †
September 2014–October 2018
2.0 (1.3 to 2.7)
October 2018–May 2020
−5.9 (−8.3 to −3.4)
Prefilled cartridge sales, by flavor type
Mint
September 2014–August 2019
14.1 (8.5 to 20.1)
August 2019–May 2020
−42.3 (−54.6 to −26.7)
Menthol
August 2019–May 2020
22.3 (14.9 to 30.1)
Tobacco
August 2019–May 2020
6.1 (3.6 to 8.7)
All other flavors
September 2014–October 2018
3.3 (2.3 to 4.2)
October 2018–May 2020
−18.1 (−28.6 to −6.0)
Disposable sales, by flavor type
Mint
September 2014–May 2020
7.4 (4.7 to 10.1)
Menthol
September 2014–May 2020
−1.4 (−2.5 to −0.3)
Tobacco
September 2014–May 2020
−1.5 (−2.1 to −0.9)
All other flavors
September 2014–May 2020
1.6 (1.3 to 1.9)
E-liquid sales, by flavor type
Mint
September 2014–May 2020
−3.5 (−4.9 to −2.2)
Menthol
September 2014–May 2020
—§§
Tobacco
September 2014–May 2020
−4.5 (−6.7 to −2.3)
All other flavors
September 2014–May 2020
−4.2 (−5.9 to −2.4)
Abbreviations: AIPC = average 4-week interval percentage change; CI = confidence interval.
* Retail sales data were obtained from Information Resources, Inc. (IRI) for convenience
stores, gas stations, grocery stores, drug stores/pharmacies, mass merchandiser outlets,
club stores, dollar stores, and military sales; data from the Internet and vape shops
were not collected.
† AIPC (CI) calculated using Joinpoint (version 4.8.0.1; National Cancer Institute).
§ Prefilled cartridges include tanks, cartridges, and pods used in rechargeable and
reusable e-cigarette device; the cartridges are not intended to be refilled after
the liquid has been depleted. Unit sales were standardized to reflect the most common
package size for each product type; a standardized unit was equal to five prefilled
cartridges.
¶ Disposable devices include nonrechargeable and nonreusable e-cigarette devices that
are not intended to be refilled with e-liquid after being depleted; the device is
disposed of once the e-liquid has been consumed. Unit sales were standardized to reflect
the most common package size for each product type; a standardized unit was equal
to 1 disposable device.
** E-liquids are containers of the liquid used in e-cigarette devices, which typically
contains a humectant (e.g., propylene glycol), nicotine, and flavoring.
†† The “All other flavors” category includes fruit, clove/spice, chocolate, alcoholic
drink (such as wine, cognac, or other cocktails), candy/desserts/other sweets, or
some other flavor. Unknown flavors were excluded from this figure (<0.1%).
§§ The dash indicates that Joinpoint regression could not be conducted because of
small sales values.
Among total e-cigarette unit sales during September 2014–August 2019, the proportion
accounted for by mint products increased from 0.01% to 43.4% (AIPC = 10.5) (p<0.05)
(Figure 1). During August 2019–May 2020, although mint sales declined from 43.4% to
2.3% of total e-cigarette sales (AIPC = −28.3), the proportion of menthol sales increased
from 11.4% to 51.6% of total sales (AIPC = 18.9), and tobacco-flavored sales increased
from 23.0% to 33.1% of total sales (AIPC = 4.6). During September 2014–October 2018,
sales of all other flavored e-cigarettes increased from 17.6% to 52.4% of total sales
(AIPC = 2.0) (p<0.05); however, sales of all other flavored e-cigarettes declined
thereafter, from 52.4% to 12.8% of total sales by May 2020 (AIPC = −5.9) (p<0.05).
Among prefilled cartridge sales during September 2014–August 2019, the percentage
that were mint increased from <0.1% to 47.6% (AIPC = 14.1) (p<0.05) (Figure 2). During
August 2019–May 2020, although the mint sales declined from 47.6% to 0.3% of all prefilled
cartridge sales (AIPC = −42.3), the proportion of menthol sales increased from 10.7%
to 61.8% (AIPC = 22.3), and the percentage of tobacco-flavored sales increased from
22.8% to 37.1% (AIPC = 6.1). During September 2014–October 2018, sales of all other
flavors increased from 12.9% to 54.4% of prefilled cartridge sales (AIPC = 3.3) (p<0.05);
however, sales of these products declined thereafter to 0.8% of all prefilled cartridge
sales by May 2020 (AIPC = −18.1) (p<0.05).
FIGURE 2
Percentage of prefilled cartridge* e-cigarette unit sales,
†
by flavor
§
— United States, September 14, 2014–May 17, 2020
* Prefilled cartridges include tanks, cartridges, and pods used in rechargeable and
reusable e-cigarette device; the cartridges are not intended to be refilled after
the liquid has been depleted. Unit sales were standardized to reflect the most common
package size for each product type; a standardized unit was equal to 5 prefilled cartridges.
† Retail sales data were obtained from Information Resources, Inc. (IRI) for convenience
stores, gas stations, grocery stores, drugstores/pharmacies, mass merchandiser outlets,
club stores, dollar stores, and military sales; data from the Internet and vape shops
were not collected.
§ The “All other flavors” category includes fruit, clove/spice, chocolate, alcoholic
drink (such as wine, cognac, or other cocktails), candy/desserts/other sweets, or
some other flavor. Unknown flavors were excluded from this figure (<0.1%).
The figure is a line chart showing the percentage of prefilled cartridge e-cigarette
unit sales, by flavor, in the United States during September 14, 2014–May 17, 2020.
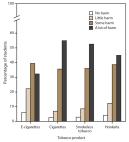
Among disposable e-cigarette sales during September 2014–May 2020, the percentage
of sales of tobacco-flavored and menthol-flavored products decreased; sales of tobacco-flavored
e-cigarettes accounted for 17.2% and menthol-flavored accounted for 10.2% of all disposable
e-cigarette sales in May 2020, (p<0.05). (Figure 3). During the same period, mint-flavored
sales increased from <0.1% to 10.5% of all disposable e-cigarette sales (AIPC = 7.4),
and the proportion of all other flavors increased from 17.2% to 62.1% (AIPC = 1.6).
FIGURE 3
Percentage of disposable e-cigarette* unit sales,
†
by flavor
§
— United States, September 14, 2014–May 17, 2020
* Disposable devices include nonrechargeable and nonreusable e-cigarette devices that
are not intended to be refilled with e-liquid after being depleted; the device is
disposed of once the e-liquid has been consumed. Unit sales were standardized to reflect
the most common package size for each product type; a standardized unit was equal
to 1 disposable device.
† Retail sales data were obtained from Information Resources, Inc. (IRI) for convenience
stores, gas stations, grocery stores, drugstores/pharmacies, mass merchandiser outlets,
club stores, dollar stores, and military sales; data from the Internet and vape shops
were not collected.
§ The “All other flavors” category includes fruit, clove/spice, chocolate, alcoholic
drink (such as wine, cognac, or other cocktails), candy/desserts/other sweets, or
some other flavor. Unknown flavors were excluded from this figure (<0.1%).
The figure is a line chart showing the percentage of disposable e-cigarette unit sales,
by flavor, in the United States during September 14, 2014–May 17, 2020.
Discussion
During November 2016–August 2019, total e-cigarette unit sales in the U.S. increased
nearly 300%. Although prefilled cartridges remained the leading product type sold,
disposable sales increased beginning in August 2019, reaching 19.8% of total sales
by May 2020. Among prefilled cartridge sales, the proportion of mint-flavored products
declined beginning in August 2019; by May 2020, menthol (61.8%) and tobacco (37.1%)
flavors dominated the market. Among disposable e-cigarette sales, tobacco-flavored
and menthol-flavored sales decreased during September 2014–May 2020; during the same
period, the proportion of sales that were mint and all other flavors increased, with
mint reaching 10.5% and all other flavors reaching 62.1% of total sales by May 2020.
Continued monitoring of e-cigarette sales could inform strategies to reduce use among
U.S. youths, including strategies that address youth-appealing product innovations
and flavors (1,2).
The increase in total e-cigarette sales that occurred during November 2016–August
2019 was driven by sales of prefilled cartridges, which made up nearly 90% of the
market by August 2019. Previous research indicates this increase in total sales was
primarily driven by JUUL (
5
), a prefilled cartridge-based e-cigarette that accounted for approximately 75% of
total U.S. e-cigarette sales by December 2018.
§
The rise in JUUL sales occurred during the same period as when youth e-cigarette use
increased considerably; during 2017–2018, current e-cigarette use increased 78% among
U.S. high school students and 48% among middle school students (
6
). The decline in total e-cigarettes sales during August 2019–February 2020 might
be attributable, in part, to shifts in consumer behaviors following the national outbreak
of e-cigarette, or vaping, product use-associated lung injury (EVALI) (
7
).
Among prefilled cartridge e-cigarettes, sales of mint and other flavors declined beginning
in August 2019, after which menthol and tobacco-flavored sales increased considerably.
During the same period, overall disposable e-cigarette sales increased, particularly
mint and other flavored (excluding menthol or tobacco) products. Flavored e-cigarette
sales patterns by product type are likely influenced by multiple factors. For example,
JUUL voluntarily removed mango, creme, fruit, and cucumber flavored cartridges from
retail stores (November 2018) and online (October 2019)
¶
and removed mint-flavored cartridges entirely from the market in November 2019.**
Moreover, on January 2, 2020, the Food and Drug Administration (FDA) finalized an
enforcement policy that prohibits the sale of prefilled cartridge e-cigarettes in
any flavor other than tobacco or menthol.
††
The findings in this report are subject to at least three limitations. First, sales
data did not include purchases from the Internet or “vape shops,” which accounted
for approximately one half of U.S. e-cigarette sales in 2019;
§§
a data source for Internet and “vape shop” sales does not currently exist. Second,
the study could not assess purchaser age. These sales could reflect products purchased
by adults or those obtained directly or indirectly by youths; however, three quarters
of youths who use JUUL, the mostly commonly sold e-cigarette brand in the United States,
reported obtaining it from a physical retail location.
¶¶
Finally, ambiguous or concept flavors were back-coded using online searches and might
be subject to misclassification; however, this only applied to 5.6% of total sales.
Youth use of tobacco products in any form, including e-cigarettes, is unsafe (1,2).
In the U.S., e-cigarette use is markedly higher among youths than adults; in 2018,
current use of e-cigarettes was 20.8% (past 30-day use) among high school students,
7.6% (everyday/someday use) among adults aged 18–24 years, and 3.2% (everyday/someday
use) among adults aged ≥18 years (
6
,
8
). In addition to regulation of the manufacturing, marketing, and sale of e-cigarettes
by FDA,*** strategies to reduce e-cigarette use among youths include increasing price,
implementing comprehensive smoke-free policies that include e-cigarettes, restricting
youths’ access to e-cigarettes in retail settings, licensing retailers, developing
educational initiatives targeting youths, curbing youth-appealing advertising and
marketing, and implementing strategies to reduce youth access to flavored tobacco
products (
1
,
2
,
9
).
Summary
What is already known about this topic?
Since electronic cigarettes (e-cigarettes) entered the U.S. marketplace in 2007, the
landscape has evolved to include disposable e-cigarettes and rechargeable e-cigarettes
with prefilled cartridges and flavored e-liquids (e.g., fruit, candy, and mint).
What is added by this report?
During September 2014–May 2020, e-cigarette sales increased by 122.2%. Sales of prefilled
cartridges increased during September 2014–August 2019; since then, sales of disposable
products have increased. Prefilled mint cartridge e-cigarette sales increased from
September 2014 to August 2019, then decreased, as menthol sales increased during August
2019–May 2020.
What are the implications for public health practice?
Continued monitoring of e-cigarette sales and use is critical to inform strategies
to minimize risks. As part of a comprehensive approach, such strategies could include
those that address youth-appealing product innovations and flavors.
Related collections
Most cited references5

- Record: found
- Abstract: found
- Article: found
Tobacco Product Use and Cessation Indicators Among Adults — United States, 2018
MeLisa Creamer, Teresa Wang, Stephen D Babb … (2019)
- Record: found
- Abstract: found
- Article: found
Vital Signs: Tobacco Product Use Among Middle and High School Students — United States, 2011–2018
Andrea S. Gentzke, MeLisa Creamer, Karen A Cullen … (2019)
- Record: found
- Abstract: found
- Article: found
Tobacco Product Use and Associated Factors Among Middle and High School Students — United States, 2019
Teresa Wang, Andrea S. Gentzke, MeLisa Creamer … (2019)