1
views
0
recommends
+1 Recommend
2 collections
    0
    shares
      • Record: found
      • Abstract: found
      • Article: not found

      Mobility Dynamics amid COVID-19 with a Case Study in Tennessee

      research-article
      1 , 1 , 2 , 1 , 3 , 4
      Transportation Research Record
      SAGE Publications
      data and data science, national and state transportation data and information systems, geospatial data, visualization in transportation, geospatial data visualization, infrastructure, infrastructure management and system preservation, pavement management systems, big data/crowdsourced data/data needs, operations, traffic flow theory and characteristics, shared mobility operations, sustainability and resilience, transportation and society, community resources and impacts, GIS and data, transportation and public health, health and transportation metrics

      Read this article at

      ScienceOpenPublisherPMC
      Bookmark
          There is no author summary for this article yet. Authors can add summaries to their articles on ScienceOpen to make them more accessible to a non-specialist audience.

          Abstract

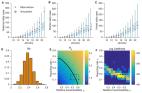
          The year 2020 has marked the spread of a global pandemic, COVID-19, challenging many aspects of our daily lives. Different organizations have been involved in controlling this outbreak. The social distancing intervention is deemed to be the most effective policy in reducing face-to-face contact and slowing down the rate of infections. Stay-at-home and shelter-in-place orders have been implemented in different states and cities, affecting daily traffic patterns. Social distancing interventions and fear of the disease resulted in a traffic decline in cities and counties. However, after stay-at-home orders ended and some public places reopened, traffic gradually started to revert to pre-pandemic levels. It can be shown that counties have diverse patterns in the decline and recovery phases. This study analyzes county-level mobility change after the pandemic, explores the contributing factors, and identifies possible spatial heterogeneity. To this end, 95 counties in Tennessee have been selected as the study area to perform geographically weighted regressions (GWR) models. The results show that density on non-freeway roads, median household income, percent of unemployment, population density, percent of people over age 65, percent of people under age 18, percent of work from home, and mean time to work are significantly correlated with vehicle miles traveled change magnitude in both decline and recovery phases. Also, the GWR estimation captures the spatial heterogeneity and local variation in coefficients among counties. Finally, the results imply that the recovery phase could be estimated depending on the identified spatial attributes. The proposed model can help agencies and researchers estimate and manage decline and recovery based on spatial factors in similar events in the future.

          Related collections

          Most cited references27

          • Record: found
          • Abstract: found
          • Article: not found

          Severe acute respiratory syndrome coronavirus 2 (SARS-CoV-2) and coronavirus disease-2019 (COVID-19): The epidemic and the challenges

          Highlights • Emergence of 2019 novel coronavirus (2019-nCoV) in China has caused a large global outbreak and major public health issue. • At 9 February 2020, data from the WHO has shown >37 000 confirmed cases in 28 countries (>99% of cases detected in China). • 2019-nCoV is spread by human-to-human transmission via droplets or direct contact. • Infection estimated to have an incubation period of 2–14 days and a basic reproduction number of 2.24–3.58. • Controlling infection to prevent spread of the 2019-nCoV is the primary intervention being used.
            Bookmark
            • Record: found
            • Abstract: found
            • Article: found
            Is Open Access

            Substantial undocumented infection facilitates the rapid dissemination of novel coronavirus (SARS-CoV2)

            Estimation of the prevalence and contagiousness of undocumented novel coronavirus (SARS-CoV2) infections is critical for understanding the overall prevalence and pandemic potential of this disease. Here we use observations of reported infection within China, in conjunction with mobility data, a networked dynamic metapopulation model and Bayesian inference, to infer critical epidemiological characteristics associated with SARS-CoV2, including the fraction of undocumented infections and their contagiousness. We estimate 86% of all infections were undocumented (95% CI: [82%–90%]) prior to 23 January 2020 travel restrictions. Per person, the transmission rate of undocumented infections was 55% of documented infections ([46%–62%]), yet, due to their greater numbers, undocumented infections were the infection source for 79% of documented cases. These findings explain the rapid geographic spread of SARS-CoV2 and indicate containment of this virus will be particularly challenging.
              Bookmark
              • Record: found
              • Abstract: found
              • Article: found
              Is Open Access

              The effect of travel restrictions on the spread of the 2019 novel coronavirus (COVID-19) outbreak

              Motivated by the rapid spread of COVID-19 in Mainland China, we use a global metapopulation disease transmission model to project the impact of travel limitations on the national and international spread of the epidemic. The model is calibrated based on internationally reported cases, and shows that at the start of the travel ban from Wuhan on 23 January 2020, most Chinese cities had already received many infected travelers. The travel quarantine of Wuhan delayed the overall epidemic progression by only 3 to 5 days in Mainland China, but has a more marked effect at the international scale, where case importations were reduced by nearly 80% until mid February. Modeling results also indicate that sustained 90% travel restrictions to and from Mainland China only modestly affect the epidemic trajectory unless combined with a 50% or higher reduction of transmission in the community.
                Bookmark

                Author and article information

                Journal
                Transp Res Rec
                Transp Res Rec
                TRR
                sptrr
                Transportation Research Record
                SAGE Publications (Sage CA: Los Angeles, CA )
                0361-1981
                2169-4052
                27 December 2021
                April 2023
                27 December 2021
                : 2677
                : 4
                : 946-959
                Affiliations
                [1 ]Department of Civil and Environmental Engineering, The University of Tennessee, Knoxville, TN
                [2 ]The Bredeson Center, The University of Tennessee, Knoxville, TN
                [3 ]Department of Geography, The University of Tennessee, Knoxville, TN
                [4 ]Traffic Operations Division, Tennessee Department of Transportation, Nashville, TN
                Author notes
                [*]Lee D. Han, lhan@ 123456utk.edu
                Author information
                https://orcid.org/0000-0003-4517-9561
                https://orcid.org/0000-0002-3291-5630
                https://orcid.org/0000-0002-4513-6548
                https://orcid.org/0000-0002-1381-1254
                Article
                10.1177_03611981211063199
                10.1177/03611981211063199
                10149353
                d1ac7521-c0dc-4796-ac6a-1cb085a22a64
                © National Academy of Sciences: Transportation Research Board 2021

                This article is made available via the PMC Open Access Subset for unrestricted re-use and analyses in any form or by any means with acknowledgement of the original source. These permissions are granted for the duration of the COVID-19 pandemic or until permissions are revoked in writing. Upon expiration of these permissions, PMC is granted a perpetual license to make this article available via PMC and Europe PMC, consistent with existing copyright protections.

                History
                Funding
                Funded by: Tennessee Department of Transportation, FundRef https://doi.org/10.13039/100012724;
                Award ID: RES2018-01
                Categories
                COVID-19 and Transportation
                Custom metadata
                ts1

                data and data science,national and state transportation data and information systems,geospatial data,visualization in transportation,geospatial data visualization,infrastructure,infrastructure management and system preservation,pavement management systems,big data/crowdsourced data/data needs,operations,traffic flow theory and characteristics,shared mobility operations,sustainability and resilience,transportation and society,community resources and impacts,gis and data,transportation and public health,health and transportation metrics

                Comments

                Comment on this article