- Record: found
- Abstract: found
- Article: found
Does Density Aggravate the COVID-19 Pandemic? : Early Findings and Lessons for Planners
Publication date (Electronic):
June 18 2020
Publisher:
Informa UK Limited
Read this article at
There is no author summary for this article yet. Authors can add summaries to their articles on ScienceOpen to make them more accessible to a non-specialist audience.
Related collections
Most cited references27
- Record: found
- Abstract: found
- Article: not found
An interactive web-based dashboard to track COVID-19 in real time
Ensheng Dong, Hongru Du, Lauren Gardner (2020)
In December, 2019, a local outbreak of pneumonia of initially unknown cause was detected in Wuhan (Hubei, China), and was quickly determined to be caused by a novel coronavirus, 1 namely severe acute respiratory syndrome coronavirus 2 (SARS-CoV-2). The outbreak has since spread to every province of mainland China as well as 27 other countries and regions, with more than 70 000 confirmed cases as of Feb 17, 2020. 2 In response to this ongoing public health emergency, we developed an online interactive dashboard, hosted by the Center for Systems Science and Engineering (CSSE) at Johns Hopkins University, Baltimore, MD, USA, to visualise and track reported cases of coronavirus disease 2019 (COVID-19) in real time. The dashboard, first shared publicly on Jan 22, illustrates the location and number of confirmed COVID-19 cases, deaths, and recoveries for all affected countries. It was developed to provide researchers, public health authorities, and the general public with a user-friendly tool to track the outbreak as it unfolds. All data collected and displayed are made freely available, initially through Google Sheets and now through a GitHub repository, along with the feature layers of the dashboard, which are now included in the Esri Living Atlas. The dashboard reports cases at the province level in China; at the city level in the USA, Australia, and Canada; and at the country level otherwise. During Jan 22–31, all data collection and processing were done manually, and updates were typically done twice a day, morning and night (US Eastern Time). As the outbreak evolved, the manual reporting process became unsustainable; therefore, on Feb 1, we adopted a semi-automated living data stream strategy. Our primary data source is DXY, an online platform run by members of the Chinese medical community, which aggregates local media and government reports to provide cumulative totals of COVID-19 cases in near real time at the province level in China and at the country level otherwise. Every 15 min, the cumulative case counts are updated from DXY for all provinces in China and for other affected countries and regions. For countries and regions outside mainland China (including Hong Kong, Macau, and Taiwan), we found DXY cumulative case counts to frequently lag behind other sources; we therefore manually update these case numbers throughout the day when new cases are identified. To identify new cases, we monitor various Twitter feeds, online news services, and direct communication sent through the dashboard. Before manually updating the dashboard, we confirm the case numbers with regional and local health departments, including the respective centres for disease control and prevention (CDC) of China, Taiwan, and Europe, the Hong Kong Department of Health, the Macau Government, and WHO, as well as city-level and state-level health authorities. For city-level case reports in the USA, Australia, and Canada, which we began reporting on Feb 1, we rely on the US CDC, the government of Canada, the Australian Government Department of Health, and various state or territory health authorities. All manual updates (for countries and regions outside mainland China) are coordinated by a team at Johns Hopkins University. The case data reported on the dashboard aligns with the daily Chinese CDC 3 and WHO situation reports 2 for within and outside of mainland China, respectively (figure ). Furthermore, the dashboard is particularly effective at capturing the timing of the first reported case of COVID-19 in new countries or regions (appendix). With the exception of Australia, Hong Kong, and Italy, the CSSE at Johns Hopkins University has reported newly infected countries ahead of WHO, with Hong Kong and Italy reported within hours of the corresponding WHO situation report. Figure Comparison of COVID-19 case reporting from different sources Daily cumulative case numbers (starting Jan 22, 2020) reported by the Johns Hopkins University Center for Systems Science and Engineering (CSSE), WHO situation reports, and the Chinese Center for Disease Control and Prevention (Chinese CDC) for within (A) and outside (B) mainland China. Given the popularity and impact of the dashboard to date, we plan to continue hosting and managing the tool throughout the entirety of the COVID-19 outbreak and to build out its capabilities to establish a standing tool to monitor and report on future outbreaks. We believe our efforts are crucial to help inform modelling efforts and control measures during the earliest stages of the outbreak.
- Record: found
- Abstract: found
- Article: found
Severe Outcomes Among Patients with Coronavirus Disease 2019 (COVID-19) — United States, February 12–March 16, 2020
Stephanie R Bialek, Ellen Boundy, Virginia Bowen … (2020)
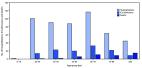
On March 18, 2020, this report was posted online as an MMWR Early Release. Globally, approximately 170,000 confirmed cases of coronavirus disease 2019 (COVID-19) caused by the 2019 novel coronavirus (SARS-CoV-2) have been reported, including an estimated 7,000 deaths in approximately 150 countries ( 1 ). On March 11, 2020, the World Health Organization declared the COVID-19 outbreak a pandemic ( 2 ). Data from China have indicated that older adults, particularly those with serious underlying health conditions, are at higher risk for severe COVID-19–associated illness and death than are younger persons ( 3 ). Although the majority of reported COVID-19 cases in China were mild (81%), approximately 80% of deaths occurred among adults aged ≥60 years; only one (0.1%) death occurred in a person aged ≤19 years ( 3 ). In this report, COVID-19 cases in the United States that occurred during February 12–March 16, 2020 and severity of disease (hospitalization, admission to intensive care unit [ICU], and death) were analyzed by age group. As of March 16, a total of 4,226 COVID-19 cases in the United States had been reported to CDC, with multiple cases reported among older adults living in long-term care facilities ( 4 ). Overall, 31% of cases, 45% of hospitalizations, 53% of ICU admissions, and 80% of deaths associated with COVID-19 were among adults aged ≥65 years with the highest percentage of severe outcomes among persons aged ≥85 years. In contrast, no ICU admissions or deaths were reported among persons aged ≤19 years. Similar to reports from other countries, this finding suggests that the risk for serious disease and death from COVID-19 is higher in older age groups. Data from cases reported from 49 states, the District of Columbia, and three U.S. territories ( 5 ) to CDC during February 12–March 16 were analyzed. Cases among persons repatriated to the United States from Wuhan, China and from Japan (including patients repatriated from cruise ships) were excluded. States and jurisdictions voluntarily reported data on laboratory-confirmed cases of COVID-19 using previously developed data collection forms ( 6 ). The cases described in this report include both COVID-19 cases confirmed by state or local public health laboratories as well as those with a positive test at the state or local public health laboratories and confirmation at CDC. No data on serious underlying health conditions were available. Data on these cases are preliminary and are missing for some key characteristics of interest, including hospitalization status (1,514), ICU admission (2,253), death (2,001), and age (386). Because of these missing data, the percentages of hospitalizations, ICU admissions, and deaths (case-fatality percentages) were estimated as a range. The lower bound of these percentages was estimated by using all cases within each age group as denominators. The corresponding upper bound of these percentages was estimated by using only cases with known information on each outcome as denominators. As of March 16, a total of 4,226 COVID-19 cases had been reported in the United States, with reports increasing to 500 or more cases per day beginning March 14 (Figure 1). Among 2,449 patients with known age, 6% were aged ≥85, 25% were aged 65–84 years, 18% each were aged 55–64 years and 45–54 years, and 29% were aged 20–44 years (Figure 2). Only 5% of cases occurred in persons aged 0–19 years. FIGURE 1 Number of new coronavirus disease 2019 (COVID-19) cases reported daily*,† (N = 4,226) — United States, February 12–March 16, 2020 * Includes both COVID-19 cases confirmed by state or local public health laboratories, as well as those testing positive at the state or local public health laboratories and confirmed at CDC. † Cases identified before February 28 were aggregated and reported during March 1–3. The figure is a histogram, an epidemiologic curve showing 4,226 coronavirus disease 2019 (COVID-19) cases, by date of case report, in the United States during February 12–March 16, 2020. Figure 2 Coronavirus disease 2019 (COVID-19) hospitalizations,* intensive care unit (ICU) admissions, † and deaths, § by age group — United States, February 12– March 16, 2020 * Hospitalization status missing or unknown for 1,514 cases. † ICU status missing or unknown for 2,253 cases. § Illness outcome or death missing or unknown for 2,001 cases. The figure is a bar chart showing the number of coronavirus disease 2019 (COVID-19) hospitalizations, intensive care unit admissions, and deaths, by age group, in the United States during February 12– March 16, 2020. Among 508 (12%) patients known to have been hospitalized, 9% were aged ≥85 years, 36% were aged 65–84 years, 17% were aged 55–64 years, 18% were 45–54 years, and 20% were aged 20–44 years. Less than 1% of hospitalizations were among persons aged ≤19 years (Figure 2). The percentage of persons hospitalized increased with age, from 2%–3% among persons aged ≤19 years, to ≥31% among adults aged ≥85 years. (Table). TABLE Hospitalization, intensive care unit (ICU) admission, and case–fatality percentages for reported COVID–19 cases, by age group —United States, February 12–March 16, 2020 Age group (yrs) (no. of cases) %* Hospitalization ICU admission Case-fatality 0–19 (123) 1.6–2.5 0 0 20–44 (705) 14.3–20.8 2.0–4.2 0.1–0.2 45–54 (429) 21.2–28.3 5.4–10.4 0.5–0.8 55–64 (429) 20.5–30.1 4.7–11.2 1.4–2.6 65–74 (409) 28.6–43.5 8.1–18.8 2.7–4.9 75–84 (210) 30.5–58.7 10.5–31.0 4.3–10.5 ≥85 (144) 31.3–70.3 6.3–29.0 10.4–27.3 Total (2,449) 20.7–31.4 4.9–11.5 1.8–3.4 * Lower bound of range = number of persons hospitalized, admitted to ICU, or who died among total in age group; upper bound of range = number of persons hospitalized, admitted to ICU, or who died among total in age group with known hospitalization status, ICU admission status, or death. Among 121 patients known to have been admitted to an ICU, 7% of cases were reported among adults ≥85 years, 46% among adults aged 65–84 years, 36% among adults aged 45–64 years, and 12% among adults aged 20–44 years (Figure 2). No ICU admissions were reported among persons aged ≤19 years. Percentages of ICU admissions were lowest among adults aged 20–44 years (2%–4%) and highest among adults aged 75–84 years (11%–31%) (Table). Among 44 cases with known outcome, 15 (34%) deaths were reported among adults aged ≥85 years, 20 (46%) among adults aged 65–84 years, and nine (20%) among adults aged 20–64 years. Case-fatality percentages increased with increasing age, from no deaths reported among persons aged ≤19 years to highest percentages (10%–27%) among adults aged ≥85 years (Table) (Figure 2). Discussion Since February 12, 4,226 COVID-19 cases were reported in the United States; 31% of cases, 45% of hospitalizations, 53% of ICU admissions, and 80% of deaths occurred among adults aged ≥65 years with the highest percentage of severe outcomes among persons aged ≥85 years. These findings are similar to data from China, which indicated >80% of deaths occurred among persons aged ≥60 years ( 3 ). These preliminary data also demonstrate that severe illness leading to hospitalization, including ICU admission and death, can occur in adults of any age with COVID-19. In contrast, persons aged ≤19 years appear to have milder COVID-19 illness, with almost no hospitalizations or deaths reported to date in the United States in this age group. Given the spread of COVID-19 in many U.S. communities, CDC continues to update current recommendations and develop new resources and guidance, including for adults aged ≥65 years as well as those involved in their care ( 7 , 8 ). Approximately 49 million U.S. persons are aged ≥65 years ( 9 ), and many of these adults, who are at risk for severe COVID-19–associated illness, might depend on services and support to maintain their health and independence. To prepare for potential COVID-19 illness among persons at high risk, family members and caregivers of older adults should know what medications they are taking and ensure that food and required medical supplies are available. Long-term care facilities should be particularly vigilant to prevent the introduction and spread of COVID-19 ( 10 ). In addition, clinicians who care for adults should be aware that COVID-19 can result in severe disease among persons of all ages. Persons with suspected or confirmed COVID-19 should monitor their symptoms and call their provider for guidance if symptoms worsen or seek emergency care for persistent severe symptoms. Additional guidance is available for health care providers on CDC’s website (https://www.cdc.gov/coronavirus/2019-nCoV/hcp/index.html). This report describes the current epidemiology of COVID-19 in the United States, using preliminary data. The findings in this report are subject to at least five limitations. First, data were missing for key variables of interest. Data on age and outcomes, including hospitalization, ICU admission, and death, were missing for 9%–53% of cases, which likely resulted in an underestimation of these outcomes. Second, further time for follow-up is needed to ascertain outcomes among active cases. Third, the initial approach to testing was to identify patients among those with travel histories or persons with more severe disease, and these data might overestimate the prevalence of severe disease. Fourth, data on other risk factors, including serious underlying health conditions that could increase risk for complications and severe illness, were unavailable at the time of this analysis. Finally, limited testing to date underscores the importance of ongoing surveillance of COVID-19 cases. Additional investigation will increase the understanding about persons who are at risk for severe illness and death from COVID-19 and inform clinical guidance and community-based mitigation measures.* The risk for serious disease and death in COVID-19 cases among persons in the United States increases with age. Social distancing is recommended for all ages to slow the spread of the virus, protect the health care system, and help protect vulnerable older adults. Further, older adults should maintain adequate supplies of nonperishable foods and at least a 30-day supply of necessary medications, take precautions to keep space between themselves and others, stay away from those who are sick, avoid crowds as much as possible, avoid cruise travel and nonessential air travel, and stay home as much as possible to further reduce the risk of being exposed ( 7 ). Persons of all ages and communities can take actions to help slow the spread of COVID-19 and protect older adults. † Summary What is already known about this topic? Early data from China suggest that a majority of coronavirus disease 2019 (COVID-19) deaths have occurred among adults aged ≥60 years and among persons with serious underlying health conditions. What is added by this report? This first preliminary description of outcomes among patients with COVID-19 in the United States indicates that fatality was highest in persons aged ≥85, ranging from 10% to 27%, followed by 3% to 11% among persons aged 65–84 years, 1% to 3% among persons aged 55-64 years, <1% among persons aged 20–54 years, and no fatalities among persons aged ≤19 years. What are the implications for public health practice? COVID-19 can result in severe disease, including hospitalization, admission to an intensive care unit, and death, especially among older adults. Everyone can take actions, such as social distancing, to help slow the spread of COVID-19 and protect older adults from severe illness.
- Record: found
- Abstract: found
- Article: not found
Clinical features of COVID-19 in elderly patients: A comparison with young and middle-aged patients
Kai Liu, Ying Chen, Ruzheng Lin … (2020)
Background Due to the general susceptibility of new coronaviruses, the clinical characteristics and outcomes of elderly and young patients may be different. Objective To analyze the clinical characteristics of elderly patients with 2019 new-type coronavirus pneumonia (COVID-19). Methods This is a retrospective study of patients with new coronavirus pneumonia (COVID-19) who were hospitalized in Hainan Provincial People's Hospital from January 15, 2020 to February 18, 2020. Compare the clinical characteristics of elderly with Young and Middle-aged patients. Results A total of 56 patients were enrolled 18 elderly patients (32.14%), and 38 young and middle-aged patients (67.86%). The most common symptoms in both groups were fever, followed by cough and sputum. Four patients in the elderly group received negative pressure ICU for mechanical ventilation, and five patients in the young and middle-aged group. One patient died in the elderly group (5.56%), and two patients died in the young and middle-aged group (5.26%). The PSI score of the elderly group was higher than that of the young and middle-aged group (P < 0.001). The proportion of patients with PSI grades IV and V was significantly higher in the elderly group than in the young and middle-aged group (P < 0.05). The proportion of multiple lobe involvement in the elderly group was higher than that in the young and middle-aged group (P < 0.001), and there was no difference in single lobe lesions between the two groups. The proportion of lymphocytes in the elderly group was significantly lower than that in the young and middle-aged group (P < 0.001), and the C-reactive protein was significantly higher in the young group (P < 0.001). The Lopinavir and Ritonavir Tablets, Chinese medicine, oxygen therapy, and mechanical ventilation were statistically different in the elderly group and the young and middle-aged group, and the P values were all <0.05. Interpretation The mortality of elderly patients with COVID-19 is higher than that of young and middle-aged patients, and the proportion of patients with PSI grade IV and V is significantly higher than that of young and middle-aged patients. Elderly patients with COVID-19 are more likely to progress to severe disease.
Author and article information
Journal
Title:
Journal of the American Planning Association
Abbreviated Title:
Journal of the American Planning Association
Publisher:
Informa UK Limited
ISSN
(Print):
0194-4363
ISSN
(Electronic):
1939-0130
Publication date
(Electronic):
June
18 2020
Pages: 1-15
Article
DOI: 10.1080/01944363.2020.1777891
SO-VID: a3885706-3790-41a2-a125-9506a19b39aa
Copyright © ©
2020
History
Data availability: