36
views
0
recommends
+1 Recommend
0 collections
    0
    shares
      • Record: found
      • Abstract: found
      • Article: found
      Is Open Access

      Global, regional, and national burden of diabetes from 1990 to 2021, with projections of prevalence to 2050: a systematic analysis for the Global Burden of Disease Study 2021

      research-article
      GBD 2021 Diabetes Collaborators
      Lancet (London, England)
      Elsevier

      Read this article at

      Bookmark
          There is no author summary for this article yet. Authors can add summaries to their articles on ScienceOpen to make them more accessible to a non-specialist audience.

          Summary

          Background

          Diabetes is one of the leading causes of death and disability worldwide, and affects people regardless of country, age group, or sex. Using the most recent evidentiary and analytical framework from the Global Burden of Diseases, Injuries, and Risk Factors Study (GBD), we produced location-specific, age-specific, and sex-specific estimates of diabetes prevalence and burden from 1990 to 2021, the proportion of type 1 and type 2 diabetes in 2021, the proportion of the type 2 diabetes burden attributable to selected risk factors, and projections of diabetes prevalence through 2050.

          Methods

          Estimates of diabetes prevalence and burden were computed in 204 countries and territories, across 25 age groups, for males and females separately and combined; these estimates comprised lost years of healthy life, measured in disability-adjusted life-years (DALYs; defined as the sum of years of life lost [YLLs] and years lived with disability [YLDs]). We used the Cause of Death Ensemble model (CODEm) approach to estimate deaths due to diabetes, incorporating 25 666 location-years of data from vital registration and verbal autopsy reports in separate total (including both type 1 and type 2 diabetes) and type-specific models. Other forms of diabetes, including gestational and monogenic diabetes, were not explicitly modelled. Total and type 1 diabetes prevalence was estimated by use of a Bayesian meta-regression modelling tool, DisMod-MR 2.1, to analyse 1527 location-years of data from the scientific literature, survey microdata, and insurance claims; type 2 diabetes estimates were computed by subtracting type 1 diabetes from total estimates. Mortality and prevalence estimates, along with standard life expectancy and disability weights, were used to calculate YLLs, YLDs, and DALYs. When appropriate, we extrapolated estimates to a hypothetical population with a standardised age structure to allow comparison in populations with different age structures. We used the comparative risk assessment framework to estimate the risk-attributable type 2 diabetes burden for 16 risk factors falling under risk categories including environmental and occupational factors, tobacco use, high alcohol use, high body-mass index (BMI), dietary factors, and low physical activity. Using a regression framework, we forecast type 1 and type 2 diabetes prevalence through 2050 with Socio-demographic Index (SDI) and high BMI as predictors, respectively.

          Findings

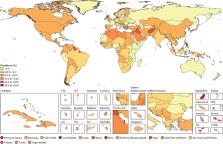
          In 2021, there were 529 million (95% uncertainty interval [UI] 500–564) people living with diabetes worldwide, and the global age-standardised total diabetes prevalence was 6·1% (5·8–6·5). At the super-region level, the highest age-standardised rates were observed in north Africa and the Middle East (9·3% [8·7–9·9]) and, at the regional level, in Oceania (12·3% [11·5–13·0]). Nationally, Qatar had the world's highest age-specific prevalence of diabetes, at 76·1% (73·1–79·5) in individuals aged 75–79 years. Total diabetes prevalence—especially among older adults—primarily reflects type 2 diabetes, which in 2021 accounted for 96·0% (95·1–96·8) of diabetes cases and 95·4% (94·9–95·9) of diabetes DALYs worldwide. In 2021, 52·2% (25·5–71·8) of global type 2 diabetes DALYs were attributable to high BMI. The contribution of high BMI to type 2 diabetes DALYs rose by 24·3% (18·5–30·4) worldwide between 1990 and 2021. By 2050, more than 1·31 billion (1·22–1·39) people are projected to have diabetes, with expected age-standardised total diabetes prevalence rates greater than 10% in two super-regions: 16·8% (16·1–17·6) in north Africa and the Middle East and 11·3% (10·8–11·9) in Latin America and Caribbean. By 2050, 89 (43·6%) of 204 countries and territories will have an age-standardised rate greater than 10%.

          Interpretation

          Diabetes remains a substantial public health issue. Type 2 diabetes, which makes up the bulk of diabetes cases, is largely preventable and, in some cases, potentially reversible if identified and managed early in the disease course. However, all evidence indicates that diabetes prevalence is increasing worldwide, primarily due to a rise in obesity caused by multiple factors. Preventing and controlling type 2 diabetes remains an ongoing challenge. It is essential to better understand disparities in risk factor profiles and diabetes burden across populations, to inform strategies to successfully control diabetes risk factors within the context of multiple and complex drivers.

          Funding

          Bill & Melinda Gates Foundation.

          Related collections

          Most cited references90

          • Record: found
          • Abstract: found
          • Article: found
          Is Open Access

          Global burden of 369 diseases and injuries in 204 countries and territories, 1990–2019: a systematic analysis for the Global Burden of Disease Study 2019

          Summary Background In an era of shifting global agendas and expanded emphasis on non-communicable diseases and injuries along with communicable diseases, sound evidence on trends by cause at the national level is essential. The Global Burden of Diseases, Injuries, and Risk Factors Study (GBD) provides a systematic scientific assessment of published, publicly available, and contributed data on incidence, prevalence, and mortality for a mutually exclusive and collectively exhaustive list of diseases and injuries. Methods GBD estimates incidence, prevalence, mortality, years of life lost (YLLs), years lived with disability (YLDs), and disability-adjusted life-years (DALYs) due to 369 diseases and injuries, for two sexes, and for 204 countries and territories. Input data were extracted from censuses, household surveys, civil registration and vital statistics, disease registries, health service use, air pollution monitors, satellite imaging, disease notifications, and other sources. Cause-specific death rates and cause fractions were calculated using the Cause of Death Ensemble model and spatiotemporal Gaussian process regression. Cause-specific deaths were adjusted to match the total all-cause deaths calculated as part of the GBD population, fertility, and mortality estimates. Deaths were multiplied by standard life expectancy at each age to calculate YLLs. A Bayesian meta-regression modelling tool, DisMod-MR 2.1, was used to ensure consistency between incidence, prevalence, remission, excess mortality, and cause-specific mortality for most causes. Prevalence estimates were multiplied by disability weights for mutually exclusive sequelae of diseases and injuries to calculate YLDs. We considered results in the context of the Socio-demographic Index (SDI), a composite indicator of income per capita, years of schooling, and fertility rate in females younger than 25 years. Uncertainty intervals (UIs) were generated for every metric using the 25th and 975th ordered 1000 draw values of the posterior distribution. Findings Global health has steadily improved over the past 30 years as measured by age-standardised DALY rates. After taking into account population growth and ageing, the absolute number of DALYs has remained stable. Since 2010, the pace of decline in global age-standardised DALY rates has accelerated in age groups younger than 50 years compared with the 1990–2010 time period, with the greatest annualised rate of decline occurring in the 0–9-year age group. Six infectious diseases were among the top ten causes of DALYs in children younger than 10 years in 2019: lower respiratory infections (ranked second), diarrhoeal diseases (third), malaria (fifth), meningitis (sixth), whooping cough (ninth), and sexually transmitted infections (which, in this age group, is fully accounted for by congenital syphilis; ranked tenth). In adolescents aged 10–24 years, three injury causes were among the top causes of DALYs: road injuries (ranked first), self-harm (third), and interpersonal violence (fifth). Five of the causes that were in the top ten for ages 10–24 years were also in the top ten in the 25–49-year age group: road injuries (ranked first), HIV/AIDS (second), low back pain (fourth), headache disorders (fifth), and depressive disorders (sixth). In 2019, ischaemic heart disease and stroke were the top-ranked causes of DALYs in both the 50–74-year and 75-years-and-older age groups. Since 1990, there has been a marked shift towards a greater proportion of burden due to YLDs from non-communicable diseases and injuries. In 2019, there were 11 countries where non-communicable disease and injury YLDs constituted more than half of all disease burden. Decreases in age-standardised DALY rates have accelerated over the past decade in countries at the lower end of the SDI range, while improvements have started to stagnate or even reverse in countries with higher SDI. Interpretation As disability becomes an increasingly large component of disease burden and a larger component of health expenditure, greater research and development investment is needed to identify new, more effective intervention strategies. With a rapidly ageing global population, the demands on health services to deal with disabling outcomes, which increase with age, will require policy makers to anticipate these changes. The mix of universal and more geographically specific influences on health reinforces the need for regular reporting on population health in detail and by underlying cause to help decision makers to identify success stories of disease control to emulate, as well as opportunities to improve. Funding Bill & Melinda Gates Foundation.
            Bookmark
            • Record: found
            • Abstract: found
            • Article: found
            Is Open Access

            Global burden of 87 risk factors in 204 countries and territories, 1990–2019: a systematic analysis for the Global Burden of Disease Study 2019

            Summary Background Rigorous analysis of levels and trends in exposure to leading risk factors and quantification of their effect on human health are important to identify where public health is making progress and in which cases current efforts are inadequate. The Global Burden of Diseases, Injuries, and Risk Factors Study (GBD) 2019 provides a standardised and comprehensive assessment of the magnitude of risk factor exposure, relative risk, and attributable burden of disease. Methods GBD 2019 estimated attributable mortality, years of life lost (YLLs), years of life lived with disability (YLDs), and disability-adjusted life-years (DALYs) for 87 risk factors and combinations of risk factors, at the global level, regionally, and for 204 countries and territories. GBD uses a hierarchical list of risk factors so that specific risk factors (eg, sodium intake), and related aggregates (eg, diet quality), are both evaluated. This method has six analytical steps. (1) We included 560 risk–outcome pairs that met criteria for convincing or probable evidence on the basis of research studies. 12 risk–outcome pairs included in GBD 2017 no longer met inclusion criteria and 47 risk–outcome pairs for risks already included in GBD 2017 were added based on new evidence. (2) Relative risks were estimated as a function of exposure based on published systematic reviews, 81 systematic reviews done for GBD 2019, and meta-regression. (3) Levels of exposure in each age-sex-location-year included in the study were estimated based on all available data sources using spatiotemporal Gaussian process regression, DisMod-MR 2.1, a Bayesian meta-regression method, or alternative methods. (4) We determined, from published trials or cohort studies, the level of exposure associated with minimum risk, called the theoretical minimum risk exposure level. (5) Attributable deaths, YLLs, YLDs, and DALYs were computed by multiplying population attributable fractions (PAFs) by the relevant outcome quantity for each age-sex-location-year. (6) PAFs and attributable burden for combinations of risk factors were estimated taking into account mediation of different risk factors through other risk factors. Across all six analytical steps, 30 652 distinct data sources were used in the analysis. Uncertainty in each step of the analysis was propagated into the final estimates of attributable burden. Exposure levels for dichotomous, polytomous, and continuous risk factors were summarised with use of the summary exposure value to facilitate comparisons over time, across location, and across risks. Because the entire time series from 1990 to 2019 has been re-estimated with use of consistent data and methods, these results supersede previously published GBD estimates of attributable burden. Findings The largest declines in risk exposure from 2010 to 2019 were among a set of risks that are strongly linked to social and economic development, including household air pollution; unsafe water, sanitation, and handwashing; and child growth failure. Global declines also occurred for tobacco smoking and lead exposure. The largest increases in risk exposure were for ambient particulate matter pollution, drug use, high fasting plasma glucose, and high body-mass index. In 2019, the leading Level 2 risk factor globally for attributable deaths was high systolic blood pressure, which accounted for 10·8 million (95% uncertainty interval [UI] 9·51–12·1) deaths (19·2% [16·9–21·3] of all deaths in 2019), followed by tobacco (smoked, second-hand, and chewing), which accounted for 8·71 million (8·12–9·31) deaths (15·4% [14·6–16·2] of all deaths in 2019). The leading Level 2 risk factor for attributable DALYs globally in 2019 was child and maternal malnutrition, which largely affects health in the youngest age groups and accounted for 295 million (253–350) DALYs (11·6% [10·3–13·1] of all global DALYs that year). The risk factor burden varied considerably in 2019 between age groups and locations. Among children aged 0–9 years, the three leading detailed risk factors for attributable DALYs were all related to malnutrition. Iron deficiency was the leading risk factor for those aged 10–24 years, alcohol use for those aged 25–49 years, and high systolic blood pressure for those aged 50–74 years and 75 years and older. Interpretation Overall, the record for reducing exposure to harmful risks over the past three decades is poor. Success with reducing smoking and lead exposure through regulatory policy might point the way for a stronger role for public policy on other risks in addition to continued efforts to provide information on risk factor harm to the general public. Funding Bill & Melinda Gates Foundation.
              Bookmark
              • Record: found
              • Abstract: found
              • Article: not found

              IDF Diabetes Atlas: Global, regional and country-level diabetes prevalence estimates for 2021 and projections for 2045

              To provide global, regional, and country-level estimates of diabetes prevalence and health expenditures for 2021 and projections for 2045.
                Bookmark

                Author and article information

                Journal
                Lancet
                Lancet
                Lancet (London, England)
                Elsevier
                0140-6736
                1474-547X
                15 July 2023
                15 July 2023
                : 402
                : 10397
                : 203-234
                Author notes
                [* ]Correspondence to: Dr Kanyin Liane Ong, Institute for Health Metrics and Evaluation, University of Washington, Seattle, WA 98195, USA ongl@ 123456uw.edu
                [†]

                Collaborators are listed at the end of the Article

                Article
                S0140-6736(23)01301-6
                10.1016/S0140-6736(23)01301-6
                10364581
                37356446
                80ddc966-bdbe-4c77-bad8-729629a2475f
                © 2023 The Author(s). Published by Elsevier Ltd. This is an Open Access article under the CC BY 4.0 license

                This is an open access article under the CC BY license (http://creativecommons.org/licenses/by/4.0/).

                History
                Categories
                Articles

                Medicine
                Medicine

                Comments

                Comment on this article