39
views
0
recommends
+1 Recommend
2 collections
    0
    shares
      • Record: found
      • Abstract: found
      • Article: found
      Is Open Access

      Increased Odds of Death for Patients with Interstitial Lung Disease and COVID-19: A Case–Control Study

      letter

      Read this article at

      Bookmark
          There is no author summary for this article yet. Authors can add summaries to their articles on ScienceOpen to make them more accessible to a non-specialist audience.

          Abstract

          To the Editor: Coronavirus disease (COVID-19) is an international public health emergency. Although the prevalence of chronic respiratory disease in patients with COVID-19 has been reportedly low (1.5%), it is associated with increased risk of severe disease and—in chronic obstructive pulmonary disease—increased mortality (1–3). Together with numerous previously reported risk factors for severe COVID-19 (1–6), it has been hypothesized that patients with interstitial lung diseases (ILDs) may have poorer outcomes from COVID-19 (7). In this letter, we present the results of a multicenter retrospective case–control study examining outcomes from COVID-19 in patients with preexisting ILD. Methods Adult patients (greater than 18 yr old) with preexisting ILD who had COVID-19 diagnosed by real-time PCR or with negative real-time PCR but positive IgM and/or IgG serology between March 1 and June 8, 2020, at six Mass General Brigham hospitals were identified using the electronic health record–integrated centralized clinical data registry. ILD was defined as physician diagnosis or, if no pulmonology visit existed in our system, as radiologic evidence with confirmatory histopathology. Patients with lung transplantation were excluded. A control cohort with COVID-19 but without ILD was identified from the same registry and preliminarily matched by age ± 5 years, sex, white/nonwhite race, and comparative health using an automated method. Control subjects were confirmed not to have ILD through medical record review, and 2:1 matching was manually verified. Other than ILD, no other comorbidities were restricted from the control cohort. Data on demographics, medical history, medications, and outcomes were collected on both cohorts; pulmonary function, computed tomographic ILD pattern, and laboratory and therapeutic data were collected on the ILD cohort. The definition of the usual interstitial pneumonitis (UIP) pattern was inclusive of both definite and probable radiographic criteria. The primary outcome of interest was death, censored on June 8, 2020. Secondary outcomes included hospital admission, ICU admission, and hospital discharge either to the home or a skilled nursing facility. Statistical analyses were performed with Wilcoxon rank-sum test, Fisher exact test, and simple and multiple logistic regression adjusting for variables of statistical and clinical interest using R 3.6.1 (https://www.r-project.org). The study was deemed exempt from informed consent by the Mass General Brigham Institutional Review Board (protocol 2020P001397). Results We identified 306 patients with ILD who underwent testing for COVID-19, of whom 46 (15%) were positive and included in our study. Of 3,091 COVID-19–positive patients without ILD, we selected 92 (3%) control subjects matched for age, sex, and race. Of note, only one case had negative real-time PCR with positive serologies for both IgM and IgG. All control subjects had positive real-time PCR results. Fifteen (33%) 
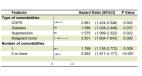
of the 46 COVID-19–positive patients with ILD died compared with 12 (13%) of the 92 control subjects without ILD, representing an increased odds ratio of death in patients with ILD of 3.2 (95% confidence interval, 1.3–7.3; P = 0.01) (Table 1). Increased mortality was observed even after adjustment for age, sex, race, smoking status, cardiovascular disease (congestive heart failure and/or coronary artery disease), and any chronic immunosuppression (odds ratio, 4.3; 95% confidence interval, 1.4–14.0; P = 0.01). Additional analyses including chronic oxygen supplementation, chronic corticosteroid use alone, or other chronic immunosuppression did not affect the significance of the association between ILD and odds of death. Of note, two cases remained hospitalized at the time of censorship, one of whom was on mechanical ventilation. Compared with patients without ILD, COVID-19–positive patients with ILD were more likely to be admitted to the hospital and to require ICU care. Furthermore, they were less likely to be discharged from the hospital, particularly to the home. Table 1. Clinical Characteristics of Patients with COVID-19 and Comorbid ILD Compared with a Matched Cohort of Patients with COVID-19 without Comorbid ILD   ILD (n = 46) No ILD (n = 92) Odds Ratio (95% CI) P Value Patient characteristics          Age, yr, median (IQR) 69 (58–78) 69 (59–78) NA NS  Sex, M, n (%) 16 (35) 32 (35) NA NS  Race, n (%)       NS   White 19 (41) 38 (41) NA   Black 9 (20) 27 (29) NA   Hispanic 12 (26) 13 (14) NA   Other 6 (13) 14 (15) NA  BMI, kg/m2, median (IQR) 27.6 (22.5–33.2) 28.7 (23.7–33.5) NA NS  Smoking status, n (%)       0.07   Never-smoker 19 (41) 57 (62) NA   Current smoker 4 (9) 5 (5) NA   Former smoker 23 (50) 30 (33) NA  Pack-years, median (IQR) 32.5 (15.0–40.0) 15.0 (8.0–27.8) NA NS Comorbidities, n (%)          Diabetes mellitus 16 (35) 31 (34) NA NS  Hypertension 35 (76) 62 (67) NA NS  Cardiovascular disease 23 (50) 30 (33) NA 0.06  Obstructive lung disease 15 (33) 25 (27) NA NS Chronic therapies, n (%)          Home oxygen supplementation 5 (11) 3 (3) NA NS  Inhaled corticosteroid 10 (22) 15 (16) NA NS  Long-acting β-agonist 7 (15) 6 (7) NA NS  Long-acting muscarinic antagonist 3 (7) 1 (1) NA NS  Corticosteroid 11 (24) 4 (4) NA 0.001  Other immunosuppression* 18 (39) 7 (8) NA <0.001  ACEi/ARB 17 (37) 32 (35) NA NS  Nonsteroidal antiinflammatory 7 (15) 8 (9) NA NS Outcomes, n (%)          Hospital admission † 34 (74) 53 (58) 2.1 (0.9–4.6) 0.07   ICU level of care 16 (47) 12 (23) 3.0 (1.2–7.9) 0.02    Mechanical ventilation 13 (81) 11 (92) 0.4 (0.03–3.1) NS   Length of stay, d 7 (5–13) 7 (5–14) NA NS   Discharged 17 (50) 45 (85) 0.2 (0.06–0.5) <0.001    Home 9 (28) 31 (58) 0.3 (0.1–0.7) 0.008    Skilled nursing facility 8 (25) 14 (26) 0.9 (0.3–2.6) NS  Death 15 (33) 12 (13) 3.2 (1.3–7.3) 0.01 Definition of abbreviations: ACEi = angiotensin-converting enzyme inhibitor; ARB = angiotensin II receptor blocker; BMI = body mass index; CI = confidence interval; COVID-19 = coronavirus disease; ILD = interstitial lung disease; IQR = interquartile range; NA = not applicable; NS = not significant (P > 0.1). * Other immunosuppression in the ILD cohort includes mycophenolate mofetil (n = 4; 22%), rituximab (n = 7; 39%), tacrolimus (n = 1; 6%), and other (n = 9; 50%). All seven non-ILD cohort immunosuppression medications were other (n = 7; 8%). † The percentages in subgroups were calculated using the parent group (i.e., the denominator for ICU level of care was hospital admission). Comparing survivors and nonsurvivors in the ILD cohort, nonsurvivors were significantly older (Table 2). We did not find evidence of an association between death from COVID-19 and male sex, race, obesity, smoking status, hypertension, diabetes, cardiovascular disease, or obstructive lung disease. The UIP pattern, present in 11 (24%) of all patients with ILD, was more common in nonsurvivors (40% vs. 16%; P = 0.14), although this was not significantly associated with death in this small subset of cases. Of those with UIP, antifibrotics were exclusively used by survivors. Overall, investigational therapies were not associated with death, although there was a trend toward more frequent treatment with hydroxychloroquine in nonsurvivors. Table 2. Clinical Characteristics of Patients with ILD and COVID-19 Stratified by Death   Survivors (n = 31; 67%) Nonsurvivors (n = 15; 33%) P Value Patient characteristics        Age, yr, median (IQR) 67 (55–72) 76 (65–90) 0.02  Sex, M, n (%) 11 (35) 5 (33) NS  Race/ethnicity, n (%)     NS   White 11 (35) 8 (53)     Black 6 (19) 3 (20)     Hispanic 9 (29) 3 (20)     Other 5 (16) 1 (7)    BMI, kg/m2, median (IQR) 27.9 (22.5–34.0) 24.0 (22.4–31.9) NS  Smoking status, n (%)     NS   Never-smoker 12 (39) 7 (47)     Former smoker 16 (52) 7 (47)     Current smoker 3 (10) 1 (7)    Pack-years, median (IQR) 35.0 (15.0–47.5) 32.5 (15.3–40.0) NS Comorbidities, n (%)        Diabetes mellitus 11 (35) 5 (33) NS  Hypertension 22 (71) 13 (87) NS  Cardiovascular disease 15 (48) 8 (53) NS  Obstructive lung disease 11 (35) 4 (27) NS Chronic therapies, n (%)        Home oxygen supplementation 2 (10) 3 (20) NS  Inhaled corticosteroid 9 (29) 1 (7) NS  Long-acting β-agonist 6 (19) 1 (7) NS  Long-acting muscarinic antagonist 1 (3) 2 (13) NS  Corticosteroid 6 (19) 5 (33) NS  Other immunosuppression* 11 (35) 7 (47) NS  Antifibrotic 3 (10) 0 (0) NS  ACEi/ARB 12 (39) 5 (33) NS  Nonsteroidal antiinflammatory 4 (13) 3 (20) NS Pulmonary characteristics        UIP (definite or probable), † n (%) 5 (16) 6 (40) NS  FEV1% predicted, median (IQR) 81 (67–90) 80 (63–104) NS  FVC% predicted, median (IQR) 79 (67–94) 79 (61–99) NS  FEV1/FVC% predicted, median (IQR) 77 (73–85) 83 (79–87) 0.09  TLC% predicted, median (IQR) 80 (65–85) 73 (68–88) NS  Dl CO_Hb% predicted, median (IQR) 58 (45–70) 37 (25–63) NS Admission laboratories        D-dimer, ng/ml, median (IQR) 1,377 (919–1,996) 1,965 (892–4,000) NS  C-reactive protein, mg/ml, median (IQR) 36.4 (24.8–103.8) 85.0 (56.4–146.5) NS  Ferritin, ng/ml, median (IQR) 297 (206–506) 701 (314–2,483) 0.02  Troponin, ng/L, median (IQR) 18.0 (7.8–45) 37.0 (20–66) 0.06  Lactate, mmol/L, median (IQR) 1.4 (1.1–1.9) 1.9 (1.6–2.4) >0.05  IL-6, pg/ml, median (IQR) 23.6 (5.8–216.6) 67.6 (28.5–212.0) NS  Acute kidney injury, n (%) 6 (30) 7 (47) NS  Liver function abnormalities, n (%) 7 (39) 8 (57) NS Therapies, n (%)        Hydroxychloroquine 4 (13) 6 (40) 0.06  Remdesivir 5 (17) 1 (7) NS  Tocilizumab 2 (7) 4 (27) NS  Steroids (new or increased dose) 3 (10) 1 (7) NS Outcomes, n (%)        Hospital admission ‡ 19 (61) 15 (100) 0.004   ICU level of care 6 (32) 9 (60) NS    Mechanical ventilation 5 (83) 8 (89) NS   Length of stay, d 7 (5–14) 6 (5–13) NS  Venous thromboembolism 3 (9) 3 (20) NS Definition of abbreviations: ACEi = angiotensin-converting enzyme inhibitor; ARB = angiotensin II receptor blocker; BMI = body mass index; COVID-19 = coronavirus disease; Dl CO_Hb = Dl CO adjusted for Hb; ILD = interstitial lung disease; IQR = interquartile range; NS = not significant (P > 0.1); UIP = usual interstitial pneumonitis. * Other immunosuppression in the survivor cohort includes mycophenolate mofetil (n = 2; 18%), rituximab (n = 5; 45%), tacrolimus (n = 1; 9%), and other (n = 5; 45%). In the nonsurvivor cohort, other immunosuppression includes mycophenolate mofetil (n = 2; 29%), rituximab (n = 2; 29%), and other (n = 4; 57%). † UIP (definite or probable by computed tomography) included idiopathic pulmonary fibrosis (n = 6), connective tissue disease–associated UIP (n = 4), and combined pulmonary fibrosis and emphysema (n = 1). Non-UIP diagnoses included non-UIP connective tissue disease–associated ILD (n = 10), cryptogenic organizing pneumonia (n = 5), nonspecific interstitial pneumonitis (n = 3), hypersensitivity pneumonitis (n = 3), non-UIP combined pulmonary fibrosis and emphysema (n = 2), smoking-associated ILD (n = 2), sarcoidosis (n = 1), lymphangioleiomyomatosis (n = 1), pleuroparenchymal fibroelastosis (n = 1), and unclassifiable (n = 7). ‡ The percentages in subgroups were calculated using the parent group (i.e., the denominator for ICU level of care was hospital admission). Discussion In this case–control study, patients with ILD who contracted COVID-19 had a greater than fourfold increased adjusted odds of death, were more likely to be hospitalized and require ICU level of care, and were less likely to be discharged, particularly to the home, compared with a matched cohort of patients with COVID-19 without ILD. Accordingly, this study suggests that comorbid ILD is a risk factor for poor outcomes from COVID-19. We observed increased odds of worse outcomes in patients with COVID-19 with underlying ILD. One explanation could be their limited pulmonary reserve. Suitably, nonsurvivors with ILD had a lower diffusion capacity and higher frequency of fibrotic UIP, although this was not statistically different from survivors. In addition, COVID-19 could lead to an acute exacerbation of ILD. Though debated, some studies suggest that viral infections may associate with ILD exacerbations (8). Finally, although the RECOVERY (Randomized Evaluation of COVID-19 Therapy) trial demonstrated that use of corticosteroids to treat COVID-19 was beneficial (9), use of chronic immunosuppression to treat underlying ILD has raised concerns that it may increase risk of disease (4). In our study, although patients with ILD had significantly increased use of chronic corticosteroids and other chronic immunosuppression compared with patients without ILD, the increased odds of death in the ILD cohort remained significantly elevated even after adjustment for chronic corticosteroid and/or other immunosuppression use. Similarly, frequency of chronic corticosteroid or other immunosuppression use, though higher in nonsurvivors compared with survivors, was not statistically associated with death. These results are consistent with those from previous coronavirus epidemics, notably severe acute respiratory syndrome and Middle East respiratory syndrome, in which chronic immunosuppression did not portend worse outcomes (10). Additional studies are needed to further assess safety of chronic immunosuppression in COVID-19. Our study had the following limitations: 1) As a case–control study, it is possible that there are additional confounding variables for which we did not account. 2) Although our observations suggest that ILD may be an independent risk factor for worse outcomes from COVID-19, our small sample size limits comprehensive assessments of other risk factors for poor outcomes within the ILD cohort. 3) Given the limited sensitivity of real-time PCR for COVID-19, it is possible that we missed additional cases who were negative by this initial testing modality. Despite this limitation, we had a high prevalence of COVID-19 in the ILD cohort (15%), although this may be due to confounding by testing rather than an increased susceptibility given the overlap between ILD and COVID-19 symptoms. This confounding, however, would tend to bias our data toward the null by capturing patients with less severe disease. 4) Constrained geographic area potentially limits the generalizability of our conclusions. Ongoing larger international studies will help further elucidate the risk factors and outcomes of patients with ILD and COVID-19. In summary, in this multicenter case–control study, patients with ILD, particularly those of advanced age, had increased odds of severe disease and death from COVID-19. Patients with ILD should be counseled of their increased risk, with an emphasis on public health measures to prevent infection in this susceptible population.

          Related collections

          Most cited references8

          • Record: found
          • Abstract: found
          • Article: not found

          Prevalence of comorbidities and its effects in patients infected with SARS-CoV-2: a systematic review and meta-analysis

          Highlights • COVID -19 cases are now confirmed in multiple countries. • Assessed the prevalence of comorbidities in infected patients. • Comorbidities are risk factors for severe compared with non-severe patients. • Help the health sector guide vulnerable populations and assess the risk of deterioration.
            Bookmark
            • Record: found
            • Abstract: found
            • Article: found
            Is Open Access

            Comorbidity and its impact on 1590 patients with Covid-19 in China: A Nationwide Analysis

            Background The coronavirus disease 2019 (Covid-19) outbreak is evolving rapidly worldwide. Objective To evaluate the risk of serious adverse outcomes in patients with coronavirus disease 2019 (Covid-19) by stratifying the comorbidity status. Methods We analysed the data from 1590 laboratory-confirmed hospitalised patients 575 hospitals in 31 province/autonomous regions/provincial municipalities across mainland China between December 11th, 2019 and January 31st, 2020. We analyse the composite endpoints, which consisted of admission to intensive care unit, or invasive ventilation, or death. The risk of reaching to the composite endpoints was compared according to the presence and number of comorbidities. Results The mean age was 48.9 years. 686 patients (42.7%) were females. Severe cases accounted for 16.0% of the study population. 131 (8.2%) patients reached to the composite endpoints. 399 (25.1%) reported having at least one comorbidity. The most prevalent comorbidity was hypertension (16.9%), followed by diabetes (8.2%). 130 (8.2%) patients reported having two or more comorbidities. After adjusting for age and smoking status, COPD [hazards ratio (HR) 2.681, 95% confidence interval (95%CI) 1.424–5.048], diabetes (HR 1.59, 95%CI 1.03–2.45), hypertension (HR 1.58, 95%CI 1.07–2.32) and malignancy (HR 3.50, 95%CI 1.60–7.64) were risk factors of reaching to the composite endpoints. The HR was 1.79 (95%CI 1.16–2.77) among patients with at least one comorbidity and 2.59 (95%CI 1.61–4.17) among patients with two or more comorbidities. Conclusion Among laboratory-confirmed cases of Covid-19, patients with any comorbidity yielded poorer clinical outcomes than those without. A greater number of comorbidities also correlated with poorer clinical outcomes.
              Bookmark
              • Record: found
              • Abstract: found
              • Article: found
              Is Open Access

              Hospitalization Rates and Characteristics of Patients Hospitalized with Laboratory-Confirmed Coronavirus Disease 2019 — COVID-NET, 14 States, March 1–30, 2020

              Since SARS-CoV-2, the novel coronavirus that causes coronavirus disease 2019 (COVID-19), was first detected in December 2019 ( 1 ), approximately 1.3 million cases have been reported worldwide ( 2 ), including approximately 330,000 in the United States ( 3 ). To conduct population-based surveillance for laboratory-confirmed COVID-19–associated hospitalizations in the United States, the COVID-19–Associated Hospitalization Surveillance Network (COVID-NET) was created using the existing infrastructure of the Influenza Hospitalization Surveillance Network (FluSurv-NET) ( 4 ) and the Respiratory Syncytial Virus Hospitalization Surveillance Network (RSV-NET). This report presents age-stratified COVID-19–associated hospitalization rates for patients admitted during March 1–28, 2020, and clinical data on patients admitted during March 1–30, 2020, the first month of U.S. surveillance. Among 1,482 patients hospitalized with COVID-19, 74.5% were aged ≥50 years, and 54.4% were male. The hospitalization rate among patients identified through COVID-NET during this 4-week period was 4.6 per 100,000 population. Rates were highest (13.8) among adults aged ≥65 years. Among 178 (12%) adult patients with data on underlying conditions as of March 30, 2020, 89.3% had one or more underlying conditions; the most common were hypertension (49.7%), obesity (48.3%), chronic lung disease (34.6%), diabetes mellitus (28.3%), and cardiovascular disease (27.8%). These findings suggest that older adults have elevated rates of COVID-19–associated hospitalization and the majority of persons hospitalized with COVID-19 have underlying medical conditions. These findings underscore the importance of preventive measures (e.g., social distancing, respiratory hygiene, and wearing face coverings in public settings where social distancing measures are difficult to maintain) † to protect older adults and persons with underlying medical conditions, as well as the general public. In addition, older adults and persons with serious underlying medical conditions should avoid contact with persons who are ill and immediately contact their health care provider(s) if they have symptoms consistent with COVID-19 (https://www.cdc.gov/coronavirus/2019-ncov/symptoms-testing/symptoms.html) ( 5 ). Ongoing monitoring of hospitalization rates, clinical characteristics, and outcomes of hospitalized patients will be important to better understand the evolving epidemiology of COVID-19 in the United States and the clinical spectrum of disease, and to help guide planning and prioritization of health care system resources. COVID-NET conducts population-based surveillance for laboratory-confirmed COVID-19–associated hospitalizations among persons of all ages in 99 counties in 14 states (California, Colorado, Connecticut, Georgia, Iowa, Maryland, Michigan, Minnesota, New Mexico, New York, Ohio, Oregon, Tennessee, and Utah), distributed across all 10 U.S Department of Health and Human Services regions. § The catchment area represents approximately 10% of the U.S. population. Patients must be residents of a designated COVID-NET catchment area and hospitalized within 14 days of a positive SARS-CoV-2 test to meet the surveillance case definition. Testing is requested at the discretion of treating health care providers. Laboratory-confirmed SARS-CoV-2 is defined as a positive result by any test that has received Emergency Use Authorization for SARS-CoV-2 testing. ¶ COVID-NET surveillance officers in each state identify cases through active review of notifiable disease and laboratory databases and hospital admission and infection control practitioner logs. Weekly age-stratified hospitalization rates are estimated using the number of catchment area residents hospitalized with laboratory-confirmed COVID-19 as the numerator and National Center for Health Statistics vintage 2018 bridged-race postcensal population estimates for the denominator.** As of April 3, 2020, COVID-NET hospitalization rates are being published each week at https://gis.cdc.gov/grasp/covidnet/COVID19_3.html. For each case, trained surveillance officers conduct medical chart abstractions using a standard case report form to collect data on patient characteristics, underlying medical conditions, clinical course, and outcomes. Chart reviews are finalized once patients have a discharge disposition. COVID-NET surveillance was initiated on March 23, 2020, with retrospective case identification of patients admitted during March 1–22, 2020, and prospective case identification during March 23–30, 2020. Clinical data on underlying conditions and symptoms at admission are presented through March 30; hospitalization rates are updated weekly and, therefore, are presented through March 28 (epidemiologic week 13). The COVID-19–associated hospitalization rate among patients identified through COVID-NET for the 4-week period ending March 28, 2020, was 4.6 per 100,000 population (Figure 1). Hospitalization rates increased with age, with a rate of 0.3 in persons aged 0–4 years, 0.1 in those aged 5–17 years, 2.5 in those aged 18–49 years, 7.4 in those aged 50–64 years, and 13.8 in those aged ≥65 years. Rates were highest among persons aged ≥65 years, ranging from 12.2 in those aged 65–74 years to 17.2 in those aged ≥85 years. More than half (805; 54.4%) of hospitalizations occurred among men; COVID-19-associated hospitalization rates were higher among males than among females (5.1 versus 4.1 per 100,000 population). Among the 1,482 laboratory-confirmed COVID-19–associated hospitalizations reported through COVID-NET, six (0.4%) each were patients aged 0–4 years and 5–17 years, 366 (24.7%) were aged 18–49 years, 461 (31.1%) were aged 50–64 years, and 643 (43.4%) were aged ≥65 years. Among patients with race/ethnicity data (580), 261 (45.0%) were non-Hispanic white (white), 192 (33.1%) were non-Hispanic black (black), 47 (8.1%) were Hispanic, 32 (5.5%) were Asian, two (0.3%) were American Indian/Alaskan Native, and 46 (7.9%) were of other or unknown race. Rates varied widely by COVID-NET surveillance site (Figure 2). FIGURE 1 Laboratory-confirmed coronavirus disease 2019 (COVID-19)–associated hospitalization rates,* by age group — COVID-NET, 14 states, † March 1–28, 2020 Abbreviation: COVID-NET = Coronavirus Disease 2019–Associated Hospitalization Surveillance Network. * Number of patients hospitalized with COVID-19 per 100,000 population. † Counties included in COVID-NET surveillance: California (Alameda, Contra Costa, and San Francisco counties); Colorado (Adams, Arapahoe, Denver, Douglas, and Jefferson counties); Connecticut (New Haven and Middlesex counties); Georgia (Clayton, Cobb, DeKalb, Douglas, Fulton, Gwinnett, Newton, and Rockdale counties); Iowa (one county represented); Maryland (Allegany, Anne Arundel, Baltimore, Baltimore City, Calvert, Caroline, Carroll, Cecil, Charles, Dorchester, Frederick, Garrett, Harford, Howard, Kent, Montgomery, Prince George’s, Queen Anne’s, St. Mary’s, Somerset, Talbot, Washington, Wicomico, and Worcester counties); Michigan (Clinton, Eaton, Genesee, Ingham, and Washtenaw counties); Minnesota (Anoka, Carver, Dakota, Hennepin, Ramsey, Scott, and Washington counties); New Mexico (Bernalillo, Chaves, Dona Ana, Grant, Luna, San Juan, and Santa Fe counties); New York (Albany, Columbia, Genesee, Greene, Livingston, Monroe, Montgomery, Ontario, Orleans, Rensselaer, Saratoga, Schenectady, Schoharie, Wayne, and Yates counties); Ohio (Delaware, Fairfield, Franklin, Hocking, Licking, Madison, Morrow, Perry, Pickaway and Union counties); Oregon (Clackamas, Multnomah, and Washington counties); Tennessee (Cheatham, Davidson, Dickson, Robertson, Rutherford, Sumner, Williamson, and Wilson counties); and Utah (Salt Lake County). The figure is a bar chart showing laboratory-confirmed COVID-19–associated hospitalization rates, by age group, in 14 states during March 1–28, 2020 according to the Coronavirus Disease 2019–Associated Hospitalization Surveillance Network. FIGURE 2 Laboratory-confirmed coronavirus disease 2019 (COVID-19)–associated hospitalization rates,* by surveillance site † — COVID-NET, 14 states, March 1–28, 2020 Abbreviation: COVID-NET = Coronavirus Disease 2019–Associated Hospitalization Surveillance Network. * Number of patients hospitalized with COVID-19 per 100,000 population. † Counties included in COVID-NET surveillance: California (Alameda, Contra Costa, and San Francisco counties); Colorado (Adams, Arapahoe, Denver, Douglas, and Jefferson counties); Connecticut (New Haven and Middlesex counties); Georgia (Clayton, Cobb, DeKalb, Douglas, Fulton, Gwinnett, Newton, and Rockdale counties); Iowa (one county represented); Maryland (Allegany, Anne Arundel, Baltimore, Baltimore City, Calvert, Caroline, Carroll, Cecil, Charles, Dorchester, Frederick, Garrett, Harford, Howard, Kent, Montgomery, Prince George’s, Queen Anne’s, St. Mary’s, Somerset, Talbot, Washington, Wicomico, and Worcester counties); Michigan (Clinton, Eaton, Genesee, Ingham, and Washtenaw counties); Minnesota (Anoka, Carver, Dakota, Hennepin, Ramsey, Scott, and Washington counties); New Mexico (Bernalillo, Chaves, Dona Ana, Grant, Luna, San Juan, and Santa Fe counties); New York (Albany, Columbia, Genesee, Greene, Livingston, Monroe, Montgomery, Ontario, Orleans, Rensselaer, Saratoga, Schenectady, Schoharie, Wayne, and Yates counties); Ohio (Delaware, Fairfield, Franklin, Hocking, Licking, Madison, Morrow, Perry, Pickaway and Union counties); Oregon (Clackamas, Multnomah, and Washington counties); Tennessee (Cheatham, Davidson, Dickson, Robertson, Rutherford, Sumner, Williamson, and Wilson counties); and Utah (Salt Lake County). The figure is a bar chart showing laboratory-confirmed COVID-19–associated hospitalization rates, by surveillance site, in 14 states during March 1–28, 2020 according to the Coronavirus Disease 2019–Associated Hospitalization Surveillance Network. During March 1–30, underlying medical conditions and symptoms at admission were reported through COVID-NET for approximately 180 (12.1%) hospitalized adults (Table); 89.3% had one or more underlying conditions. The most commonly reported were hypertension (49.7%), obesity (48.3%), chronic lung disease (34.6%), diabetes mellitus (28.3%), and cardiovascular disease (27.8%). Among patients aged 18–49 years, obesity was the most prevalent underlying condition, followed by chronic lung disease (primarily asthma) and diabetes mellitus. Among patients aged 50–64 years, obesity was most prevalent, followed by hypertension and diabetes mellitus; and among those aged ≥65 years, hypertension was most prevalent, followed by cardiovascular disease and diabetes mellitus. Among 33 females aged 15–49 years hospitalized with COVID-19, three (9.1%) were pregnant. Among 167 patients with available data, the median interval from symptom onset to admission was 7 days (interquartile range [IQR] = 3–9 days). The most common signs and symptoms at admission included cough (86.1%), fever or chills (85.0%), and shortness of breath (80.0%). Gastrointestinal symptoms were also common; 26.7% had diarrhea, and 24.4% had nausea or vomiting. TABLE Underlying conditions and symptoms among adults aged ≥18 years with coronavirus disease 2019 (COVID-19)–associated hospitalizations — COVID-NET, 14 states,* March 1–30, 2020† Underlying condition Age group (yrs), no./total no. (%) Overall 18–49 50–64 ≥65 years Any underlying condition 159/178 (89.3) 41/48 (85.4) 51/59 (86.4) 67/71 (94.4) Hypertension 79/159 (49.7) 7/40 (17.5) 27/57 (47.4) 45/62 (72.6) Obesity§ 73/151 (48.3) 23/39 (59.0) 25/51 (49.0) 25/61 (41.0) Chronic metabolic disease¶ 60/166 (36.1) 10/46 (21.7) 21/56 (37.5) 29/64 (45.3)    Diabetes mellitus 47/166 (28.3) 9/46 (19.6) 18/56 (32.1) 20/64 (31.3) Chronic lung disease 55/159 (34.6) 16/44 (36.4) 15/53 (28.3) 24/62 (38.7)    Asthma 27/159 (17.0) 12/44 (27.3) 7/53 (13.2) 8/62 (12.9)    Chronic obstructive pulmonary disease 17/159 (10.7) 0/44 (0.0) 3/53 (5.7) 14/62 (22.6) Cardiovascular disease** 45/162 (27.8) 2/43 (4.7) 11/56 (19.6) 32/63 (50.8)    Coronary artery disease 23/162 (14.2) 0/43 (0.0) 7/56 (12.5) 16/63 (25.4)    Congestive heart failure 11/162 (6.8) 2/43 (4.7) 3/56 (5.4) 6/63 (9.5) Neurologic disease 22/157 (14.0) 4/42 (9.5) 4/55 (7.3) 14/60 (23.3) Renal disease 20/153 (13.1) 3/41 (7.3) 2/53 (3.8) 15/59 (25.4) Immunosuppressive condition 15/156 (9.6) 5/43 (11.6) 4/54 (7.4) 6/59 (10.2) Gastrointestinal/Liver disease 10/152 (6.6) 4/42 (9.5) 0/54 (0.0) 6/56 (10.7) Blood disorder 9/156 (5.8) 1/43 (2.3) 1/55 (1.8) 7/58 (12.1) Rheumatologic/Autoimmune disease 3/154 (1.9) 1/42 (2.4) 0/54 (0.0) 2/58 (3.4) Pregnancy†† 3/33 (9.1) 3/33 (9.1) N/A N/A Symptom §§ Cough 155/180 (86.1) 43/47 (91.5) 54/60 (90.0) 58/73 (79.5) Fever/Chills 153/180 (85.0) 38/47 (80.9) 53/60 (88.3) 62/73 (84.9) Shortness of breath 144/180 (80.0) 40/47 (85.1) 50/60 (83.3) 54/73 (74.0) Myalgia 62/180 (34.4) 20/47 (42.6) 23/60 (38.3) 19/73 (26.0) Diarrhea 48/180 (26.7) 10/47 (21.3) 17/60 (28.3) 21/73 (28.8) Nausea/Vomiting 44/180 (24.4) 12/47 (25.5) 17/60 (28.3) 15/73 (20.5) Sore throat 32/180 (17.8) 8/47 (17.0) 13/60 (21.7) 11/73 (15.1) Headache 29/180 (16.1) 10/47 (21.3) 12/60 (20.0) 7/73 (9.6) Nasal congestion/Rhinorrhea 29/180 (16.1) 8/47 (17.0) 13/60 (21.7) 8/73 (11.0) Chest pain 27/180 (15.0) 9/47 (19.1) 13/60 (21.7) 5/73 (6.8) Abdominal pain 15/180 (8.3) 6/47 (12.8) 6/60 (10.0) 3/73 (4.1) Wheezing 12/180 (6.7) 3/47 (6.4) 2/60 (3.3) 7/73 (9.6) Altered mental status/Confusion 11/180 (6.1) 3/47 (6.4) 2/60 (3.3) 6/73 (8.2) Abbreviations: COVID-NET = Coronavirus Disease 2019–Associated Hospitalization Surveillance Network; N/A = not applicable. * Counties included in COVID-NET surveillance: California (Alameda, Contra Costa, and San Francisco counties); Colorado (Adams, Arapahoe, Denver, Douglas, and Jefferson counties); Connecticut (New Haven and Middlesex counties); Georgia (Clayton, Cobb, DeKalb, Douglas, Fulton, Gwinnett, Newton, and Rockdale counties); Iowa (one county represented); Maryland (Allegany, Anne Arundel, Baltimore, Baltimore City, Calvert, Caroline, Carroll, Cecil, Charles, Dorchester, Frederick, Garrett, Harford, Howard, Kent, Montgomery, Prince George’s, Queen Anne’s, St. Mary’s, Somerset, Talbot, Washington, Wicomico, and Worcester counties); Michigan (Clinton, Eaton, Genesee, Ingham, and Washtenaw counties); Minnesota (Anoka, Carver, Dakota, Hennepin, Ramsey, Scott, and Washington counties); New Mexico (Bernalillo, Chaves, Dona Ana, Grant, Luna, San Juan, and Santa Fe counties); New York (Albany, Columbia, Genesee, Greene, Livingston, Monroe, Montgomery, Ontario, Orleans, Rensselaer, Saratoga, Schenectady, Schoharie, Wayne, and Yates counties); Ohio (Delaware, Fairfield, Franklin, Hocking, Licking, Madison, Morrow, Perry, Pickaway and Union counties); Oregon (Clackamas, Multnomah, and Washington counties); Tennessee (Cheatham, Davidson, Dickson, Robertson, Rutherford, Sumner, Williamson, and Wilson counties); and Utah (Salt Lake County). † COVID-NET included data for one child aged 5–17 years with underlying medical conditions and symptoms at admission; data for this child are not included in this table. This child was reported to have chronic lung disease (asthma). Symptoms included fever, cough, gastrointestinal symptoms, shortness of breath, chest pain, and a sore throat on admission. § Obesity is defined as calculated body mass index (BMI) ≥30 kg/m2, and if BMI is missing, by International Classification of Diseases discharge diagnosis codes. Among 73 patients with obesity, 51 (69.9%) had obesity defined as BMI 30–<40 kg/m2, and 22 (30.1%) had severe obesity defined as BMI ≥40 kg/m2. ¶ Among the 60 patients with chronic metabolic disease, 45 had diabetes mellitus only, 13 had thyroid dysfunction only, and two had diabetes mellitus and thyroid dysfunction. ** Cardiovascular disease excludes hypertension. †† Restricted to women aged 15–49 years. §§ Symptoms were collected through review of admission history and physical exam notes in the medical record and might be determined by subjective or objective findings. In addition to the symptoms in the table, the following less commonly reported symptoms were also noted for adults with information on symptoms (180): hemoptysis/bloody sputum (2.2%), rash (1.1%), conjunctivitis (0.6%), and seizure (0.6%). Discussion During March 1–28, 2020, the overall laboratory-confirmed COVID-19–associated hospitalization rate was 4.6 per 100,000 population; rates increased with age, with the highest rates among adults aged ≥65 years. Approximately 90% of hospitalized patients identified through COVID-NET had one or more underlying conditions, the most common being obesity, hypertension, chronic lung disease, diabetes mellitus, and cardiovascular disease. Using the existing infrastructure of two respiratory virus surveillance platforms, COVID-NET was implemented to produce robust, weekly, age-stratified hospitalization rates using standardized data collection methods. These data are being used, along with data from other surveillance platforms (https://www.cdc.gov/coronavirus/2019-ncov/covid-data/covidview.html), to monitor COVID-19 disease activity and severity in the United States. During the first month of surveillance, COVID-NET hospitalization rates ranged from 0.1 per 100,000 population in persons aged 5–17 years to 17.2 per 100,000 population in adults aged ≥85 years, whereas cumulative influenza hospitalization rates during the first 4 weeks of each influenza season (epidemiologic weeks 40–43) over the past 5 seasons have ranged from 0.1 in persons aged 5–17 years to 2.2–5.4 in adults aged ≥85 years ( 6 ). COVID-NET rates during this first 4-week period of surveillance are preliminary and should be interpreted with caution; given the rapidly evolving nature of the COVID-19 pandemic, rates are expected to increase as additional cases are identified and as SARS-CoV-2 testing capacity in the United States increases. In the COVID-NET catchment population, approximately 49% of residents are male and 51% of residents are female, whereas 54% of COVID-19-associated hospitalizations occurred in males and 46% occurred in females. These data suggest that males may be disproportionately affected by COVID-19 compared with females. Similarly, in the COVID-NET catchment population, approximately 59% of residents are white, 18% are black, and 14% are Hispanic; however, among 580 hospitalized COVID-19 patients with race/ethnicity data, approximately 45% were white, 33% were black, and 8% were Hispanic, suggesting that black populations might be disproportionately affected by COVID-19. These findings, including the potential impact of both sex and race on COVID-19-associated hospitalization rates, need to be confirmed with additional data. Most of the hospitalized patients had underlying conditions, some of which are recognized to be associated with severe COVID-19 disease, including chronic lung disease, cardiovascular disease, diabetes mellitus ( 5 ). COVID-NET does not collect data on nonhospitalized patients; thus, it was not possible to compare the prevalence of underlying conditions in hospitalized versus nonhospitalized patients. Many of the documented underlying conditions among hospitalized COVID-19 patients are highly prevalent in the United States. According to data from the National Health and Nutrition Examination Survey, hypertension prevalence among U.S. adults is 29% overall, ranging from 7.5%–63% across age groups ( 7 ), and age-adjusted obesity prevalence is 42% (range across age groups = 40%–43%) ( 8 ). Among hospitalized COVID-19 patients, hypertension prevalence was 50% (range across age groups = 18%–73%), and obesity prevalence was 48% (range across age groups = 41%–59%). In addition, the prevalences of several underlying conditions identified through COVID-NET were similar to those for hospitalized influenza patients identified through FluSurv-NET during influenza seasons 2014–15 through 2018–19: 41%–51% of patients had cardiovascular disease (excluding hypertension), 39%–45% had chronic metabolic disease, 33%–40% had obesity, and 29%–31% had chronic lung disease ( 6 ). Data on hypertension are not collected by FluSurv-NET. Among women aged 15–49 years hospitalized with COVID-19 and identified through COVID-NET, 9% were pregnant, which is similar to an estimated 9.9% of the general population of women aged 15–44 years who are pregnant at any given time based on 2010 data. †† Similar to other reports from the United States ( 9 ) and China ( 1 ), these findings indicate that a high proportion of U.S. patients hospitalized with COVID-19 are older and have underlying medical conditions. The findings in this report are subject to at least three limitations. First, hospitalization rates by age and COVID-NET site are preliminary and might change as additional cases are identified from this surveillance period. Second, whereas minimum case data to produce weekly age-stratified hospitalization rates are usually available within 7 days of case identification, availability of detailed clinical data are delayed because of the need for medical chart abstractions. As of March 30, chart abstractions had been conducted for approximately 200 COVID-19 patients; the frequency and distribution of underlying conditions during this time might change as additional data become available. Clinical course and outcomes will be presented once the number of cases with complete medical chart abstractions are sufficient; many patients are still hospitalized at the time of this report. Finally, testing for SARS-CoV-2 among patients identified through COVID-NET is performed at the discretion of treating health care providers, and testing practices and capabilities might vary widely across providers and facilities. As a result, underascertainment of cases in COVID-NET is likely. Additional data on testing practices related to SARS-CoV-2 will be collected in the future to account for underascertainment using described methods ( 10 ). Early data from COVID-NET suggest that COVID-19–associated hospitalizations in the United States are highest among older adults, and nearly 90% of persons hospitalized have one or more underlying medical conditions. These findings underscore the importance of preventive measures (e.g., social distancing, respiratory hygiene, and wearing face coverings in public settings where social distancing measures are difficult to maintain) to protect older adults and persons with underlying medical conditions. Ongoing monitoring of hospitalization rates, clinical characteristics, and outcomes of hospitalized patients will be important to better understand the evolving epidemiology of COVID-19 in the United States and the clinical spectrum of disease, and to help guide planning and prioritization of health care system resources. Summary What is already known about this topic? Population-based rates of laboratory-confirmed coronavirus disease 2019 (COVID-19)–associated hospitalizations are lacking in the United States. What is added by this report? COVID-NET was implemented to produce robust, weekly, age-stratified COVID-19–associated hospitalization rates. Hospitalization rates increase with age and are highest among older adults; the majority of hospitalized patients have underlying conditions. What are the implications for public health practice? Strategies to prevent COVID-19, including social distancing, respiratory hygiene, and face coverings in public settings where social distancing measures are difficult to maintain, are particularly important to protect older adults and those with underlying conditions. Ongoing monitoring of hospitalization rates is critical to understanding the evolving epidemiology of COVID-19 in the United States and to guide planning and prioritization of health care resources.
                Bookmark

                Author and article information

                Journal
                Am J Respir Crit Care Med
                Am J Respir Crit Care Med
                ajrccm
                American Journal of Respiratory and Critical Care Medicine
                American Thoracic Society
                1073-449X
                1535-4970
                15 December 2020
                15 December 2020
                15 December 2020
                15 December 2020
                : 202
                : 12
                : 1710-1713
                Affiliations
                [ 1 ]Brigham and Women’s Hospital

                Boston, Massachusetts
                Author notes
                [*]

                These authors contributed equally to this work.

                [ ]Corresponding author (e-mail: tjdoyle@ 123456bwh.harvard.edu ).
                Author information
                http://orcid.org/0000-0002-8636-0845
                http://orcid.org/0000-0002-0211-4509
                http://orcid.org/0000-0003-0334-4039
                http://orcid.org/0000-0002-8027-7450
                http://orcid.org/0000-0002-7447-6453
                http://orcid.org/0000-0003-2929-5589
                http://orcid.org/0000-0002-2319-0009
                http://orcid.org/0000-0003-1673-9523
                http://orcid.org/0000-0001-9782-2841
                http://orcid.org/0000-0002-0770-1059
                Article
                202006-2441LE
                10.1164/rccm.202006-2441LE
                7737588
                32897754
                74b11b55-5438-4c8c-a629-60b934c0b200
                Copyright © 2020 by the American Thoracic Society

                This article is open access and distributed under the terms of the Creative Commons Attribution Non-Commercial No Derivatives License 4.0 ( http://creativecommons.org/licenses/by-nc-nd/4.0/). For commercial usage and reprints, please contact Diane Gern ( dgern@ 123456thoracic.org ).

                History
                Page count
                Figures: 0, Tables: 2, Pages: 4
                Categories
                Correspondence

                Comments

                Comment on this article