8
views
0
recommends
+1 Recommend
0 collections
    0
    shares
      • Record: found
      • Abstract: found
      • Article: found
      Is Open Access

      Cortical structural differences in major depressive disorder correlate with cell type-specific transcriptional signatures

      research-article

      Read this article at

      Bookmark
          There is no author summary for this article yet. Authors can add summaries to their articles on ScienceOpen to make them more accessible to a non-specialist audience.

          Abstract

          Major depressive disorder (MDD) has been shown to be associated with structural abnormalities in a variety of spatially diverse brain regions. However, the correlation between brain structural changes in MDD and gene expression is unclear. Here, we examine the link between brain-wide gene expression and morphometric changes in individuals with MDD, using neuroimaging data from two independent cohorts and a publicly available transcriptomic dataset. Morphometric similarity network (MSN) analysis shows replicable cortical structural differences in individuals with MDD compared to control subjects. Using human brain gene expression data, we observe that the expression of MDD-associated genes spatially correlates with MSN differences. Analysis of cell type-specific signature genes suggests that microglia and neuronal specific transcriptional changes account for most of the observed correlation with MDD-specific MSN differences. Collectively, our findings link molecular and structural changes relevant for MDD.

          Abstract

          The correlation between brain structural changes in major depressive disorder (MDD) and gene expression is unclear. Here, the authors explore the correlation between cell type-specific gene expression changes and cortical structural difference in individuals with major depressive disorder.

          Related collections

          Most cited references82

          • Record: found
          • Abstract: found
          • Article: found
          Is Open Access

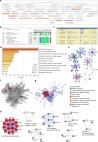
          Metascape provides a biologist-oriented resource for the analysis of systems-level datasets

          A critical component in the interpretation of systems-level studies is the inference of enriched biological pathways and protein complexes contained within OMICs datasets. Successful analysis requires the integration of a broad set of current biological databases and the application of a robust analytical pipeline to produce readily interpretable results. Metascape is a web-based portal designed to provide a comprehensive gene list annotation and analysis resource for experimental biologists. In terms of design features, Metascape combines functional enrichment, interactome analysis, gene annotation, and membership search to leverage over 40 independent knowledgebases within one integrated portal. Additionally, it facilitates comparative analyses of datasets across multiple independent and orthogonal experiments. Metascape provides a significantly simplified user experience through a one-click Express Analysis interface to generate interpretable outputs. Taken together, Metascape is an effective and efficient tool for experimental biologists to comprehensively analyze and interpret OMICs-based studies in the big data era.
            Bookmark
            • Record: found
            • Abstract: found
            • Article: not found

            An automated labeling system for subdividing the human cerebral cortex on MRI scans into gyral based regions of interest.

            In this study, we have assessed the validity and reliability of an automated labeling system that we have developed for subdividing the human cerebral cortex on magnetic resonance images into gyral based regions of interest (ROIs). Using a dataset of 40 MRI scans we manually identified 34 cortical ROIs in each of the individual hemispheres. This information was then encoded in the form of an atlas that was utilized to automatically label ROIs. To examine the validity, as well as the intra- and inter-rater reliability of the automated system, we used both intraclass correlation coefficients (ICC), and a new method known as mean distance maps, to assess the degree of mismatch between the manual and the automated sets of ROIs. When compared with the manual ROIs, the automated ROIs were highly accurate, with an average ICC of 0.835 across all of the ROIs, and a mean distance error of less than 1 mm. Intra- and inter-rater comparisons yielded little to no difference between the sets of ROIs. These findings suggest that the automated method we have developed for subdividing the human cerebral cortex into standard gyral-based neuroanatomical regions is both anatomically valid and reliable. This method may be useful for both morphometric and functional studies of the cerebral cortex as well as for clinical investigations aimed at tracking the evolution of disease-induced changes over time, including clinical trials in which MRI-based measures are used to examine response to treatment.
              Bookmark
              • Record: found
              • Abstract: found
              • Article: not found

              The organization of the human cerebral cortex estimated by intrinsic functional connectivity.

              Information processing in the cerebral cortex involves interactions among distributed areas. Anatomical connectivity suggests that certain areas form local hierarchical relations such as within the visual system. Other connectivity patterns, particularly among association areas, suggest the presence of large-scale circuits without clear hierarchical relations. In this study the organization of networks in the human cerebrum was explored using resting-state functional connectivity MRI. Data from 1,000 subjects were registered using surface-based alignment. A clustering approach was employed to identify and replicate networks of functionally coupled regions across the cerebral cortex. The results revealed local networks confined to sensory and motor cortices as well as distributed networks of association regions. Within the sensory and motor cortices, functional connectivity followed topographic representations across adjacent areas. In association cortex, the connectivity patterns often showed abrupt transitions between network boundaries. Focused analyses were performed to better understand properties of network connectivity. A canonical sensory-motor pathway involving primary visual area, putative middle temporal area complex (MT+), lateral intraparietal area, and frontal eye field was analyzed to explore how interactions might arise within and between networks. Results showed that adjacent regions of the MT+ complex demonstrate differential connectivity consistent with a hierarchical pathway that spans networks. The functional connectivity of parietal and prefrontal association cortices was next explored. Distinct connectivity profiles of neighboring regions suggest they participate in distributed networks that, while showing evidence for interactions, are embedded within largely parallel, interdigitated circuits. We conclude by discussing the organization of these large-scale cerebral networks in relation to monkey anatomy and their potential evolutionary expansion in humans to support cognition.
                Bookmark

                Author and article information

                Contributors
                chenhf@uestc.edu.cn
                weiliao.wl@gmail.com
                Journal
                Nat Commun
                Nat Commun
                Nature Communications
                Nature Publishing Group UK (London )
                2041-1723
                12 March 2021
                12 March 2021
                2021
                : 12
                : 1647
                Affiliations
                [1 ]GRID grid.54549.39, ISNI 0000 0004 0369 4060, The Clinical Hospital of Chengdu Brain Science Institute, School of Life Science and Technology, , University of Electronic Science and Technology of China, ; Chengdu, P.R. China
                [2 ]GRID grid.54549.39, ISNI 0000 0004 0369 4060, MOE Key Lab for Neuroinformation, High-Field Magnetic Resonance Brain Imaging Key Laboratory of Sichuan Province, , University of Electronic Science and Technology of China, ; Chengdu, P.R. China
                [3 ]GRID grid.239552.a, ISNI 0000 0001 0680 8770, Children’s Hospital of Philadelphia, Department of Child and Adolescent Psychiatry and Behavioral Science, ; Philadelphia, PA USA
                [4 ]GRID grid.25879.31, ISNI 0000 0004 1936 8972, University of Pennsylvania, Department of Psychiatry, ; Philadelphia, PA USA
                [5 ]GRID grid.5335.0, ISNI 0000000121885934, University of Cambridge, Department of Psychiatry, ; Cambridge, UK
                [6 ]GRID grid.186775.a, ISNI 0000 0000 9490 772X, Department of Medical Psychology, Chaohu Clinical Medical College, , Anhui Medical University, ; Hefei, P.R. China
                [7 ]GRID grid.263906.8, School of Psychology, , Southwest University, ; Chongqing, P.R. China
                Author information
                http://orcid.org/0000-0002-8164-7476
                http://orcid.org/0000-0001-7406-7193
                Article
                21943
                10.1038/s41467-021-21943-5
                7955076
                33712584
                0230d638-b5c4-46a6-b774-54df2f162950
                © The Author(s) 2021

                Open Access This article is licensed under a Creative Commons Attribution 4.0 International License, which permits use, sharing, adaptation, distribution and reproduction in any medium or format, as long as you give appropriate credit to the original author(s) and the source, provide a link to the Creative Commons license, and indicate if changes were made. The images or other third party material in this article are included in the article’s Creative Commons license, unless indicated otherwise in a credit line to the material. If material is not included in the article’s Creative Commons license and your intended use is not permitted by statutory regulation or exceeds the permitted use, you will need to obtain permission directly from the copyright holder. To view a copy of this license, visit http://creativecommons.org/licenses/by/4.0/.

                History
                : 22 September 2020
                : 12 February 2021
                Funding
                Funded by: FundRef https://doi.org/10.13039/501100001809, National Natural Science Foundation of China (National Science Foundation of China);
                Award ID: 61871077
                Award Recipient :
                Categories
                Article
                Custom metadata
                © The Author(s) 2021

                Uncategorized
                gene expression profiling,depression,brain
                Uncategorized
                gene expression profiling, depression, brain

                Comments

                Comment on this article