
Introduction
Sustainable food production is required to meet the demand of a growing and more affluent world population in combination with a changing climate (Smith & Gregory, 2013), a challenge which will require efficient ways to manage nutrients and mitigate the losses to water (Schoumans et al., 2014). Phosphorus (P) and nitrogen (N) are the main nutrients driving eutrophication, which has a detrimental effect on water ecology (Carpenter et al., 1998) and has negative implications for the food chain (Withers et al., 2014). To achieve the challenge of reducing nutrient loss to waters, we need a comprehensive understanding of how both agronomic and climate drivers influence nutrient loss along the whole nutrient transfer continuum and what the impacts are, both over time and space, and for catchments with different physical settings. We also need to understand the economical drivers’ and farmers’ attitudes and willingness to adapt to changes (Arbuckle et al., 2013).
The European Union (EU) member states are required to monitor their Nitrates Regulations or the National Action Plan (NAP), under Article 5 (6) of the EU Nitrates Directive (ND) (Official Journal of the European Community [OJEC], 1991). In Ireland, the Department of Agriculture, Food and the Marine (DAFM) monitors the implementation of the NAP through the “Good Agricultural Practice for Protection of Waters” regulations (GAP). The DAFM has funded the Agricultural Catchments Programme (ACP) to monitor the effectiveness of the GAP measures since 2008. Catchment monitoring is required to support Ireland’s derogation (farming at higher stocking rates 170–250 kg livestock manure N/ha) under Article 8 of the Commission’s Decision granting a derogation requested by Ireland (Official Journal of the European Community, 2007/697/EC). Therefore, the ACP provides a scientific basis for policy review of the NAP, its derogation across different soil types and land use and the influence of agriculture on the Water Framework Directives objectives (OJEC, 2000).
The ACP is a collaboration with over 300 farmers in six small river catchments in Ireland and is currently in its fourth 4-yr cycle of funding. The programme has taken a whole catchment approach. By using the “nutrient transfer continuum” (Haygarth et al., 2005) as a conceptual framework, an extensive monitoring programme of nutrient sources and hydro-chemo-metrics have been implemented similarly across all six catchments. This facilitates an understanding of how nutrients are lost from agricultural sources, how they can be mobilised and transferred via different hydrological pathways, how they are delivered to water and where there may be a negative impact on water quality and aquatic ecology. The whole catchment approach was agreed upon during the first phase of the programme by the ACP Expert Steering Group composed of internationally leading scientists and national policy makers.
A strength of the ACP is the long-term and high-frequency monitoring. The programme uses simultaneous high-frequency monitoring of streamflow and stream water chemistry, which provides many advantages that increase as the technology quickly advances (Rode et al., 2016). High-frequency data have facilitated the use of analytical methods that allow us to identify and quantify nutrient transfer pathways, such as concentration–discharge hysteresis (e.g. Bieroza & Heathwaite, 2015), loadograph recession analysis (Mellander et al., 2012a, 2012b) and methods to evaluate the effectiveness of water management interventions such as concentration–discharge slope (Bieroza et al., 2018) and extended end-member mixing analysis (Jarvie et al., 2011). The long-term aspect is required to encompass time lags in the system, as well as changing weather and policy drivers. At the regional catchment scale, time lags can vary widely in magnitude from weeks to decades, depending on the underlying catchment geology (Fenton et al., 2011). The dominant mechanisms for nutrient mobilisation and the dominant transport pathways for nutrient transfer depend on the spatial and temporal scales considered (Fenton et al., 2011) and this will in turn dictate the time lag. This often means that it is difficult to assess the impact of diffuse pollution abatement programmes as the impacts of changes in management practice may not be observed until several years or decades after implementation (Benettin et al., 2013).
Both anthropogenic warming (Schaller et al., 2016) and changes in the large-scale climate systems over the North Atlantic influence the weather in Ireland (Yiou & Nogaj, 2004). During the programme, there have been changes in air temperature, rainfall patterns and more extreme weather events. Examples are the severe summer drought of 2018 (Falzoi et al., 2019) and the wettest decade in 300 yr (Murphy et al., 2018). Despite difficulties in directly linking climate change with water quality (Michalak, 2016), recent findings have stressed the importance of shifts in climate and weather conditions for agricultural nutrient loss. For example, in Great Britain up to 80% reductions in agricultural P loss are required to offset the projected increased P loss associated with climate change, and current mitigation efforts will not be sufficient (Ockenden et al., 2017). A dynamic modelling study in Ireland found that changes in climate had the potential to influence the total P loads more than changes in either population or land use (Jennings et al., 2009).
The ACP links the socioeconomic element with the biophysical component. This allows for the development of a deeper understanding of the processes related to policy changes and farm management decisions. After more than a decade of holistic agro-environmental studies within the ACP, the objective of this paper is to review the research output from the ACP and projects linked to the programme, to summarise the key biophysical, socioeconomical and knowledge transfer (KT) findings and support further research, environmental policy and nutrient management planning (NMP).
Experimental design
The ACP consists of six meso-scale catchments, five river catchments and one karst spring zone, ranging in size from 3 to 30 km2 (Figure 1, Table 1). These were selected by a multi-criteria analysis (Fealy et al., 2010) to represent intensively managed agricultural land on different physical settings and dominating land use (mainly grassland or arable land). The six catchments therefore represent different types of riskiness for N and P loss in terms of dominating transfer pathways (leaching to groundwater or runoff with surface water). The catchment size was chosen to be large enough to encompass the range of hydrological conditions from headwaters to the main river channel, allowing for normal N and P transformation and mobilisation processes to occur, and also to integrate the impacts of a realistic range of farm practices within a typical farming system (Wall et al., 2011). Individual farmer preference did not influence catchment site selection, and the areas were chosen prior to notifying landowners. However, active engagement with farmers is key to the programme, and this is achieved mainly through the provision of an advisory service, where each catchment advisor deals with approximately 80 clients. Catchment and farm boundaries do not align. Consequently, many of the 300 farms across the six catchments also have significant areas of land outside the catchment boundaries.

Overview of the six river catchments monitored within the Agricultural Catchments Programme. The figure includes the 10-yr annual average total phosphorus (TP), total reactive phosphorus (TRP) and nitrate-N (NO3-N) concentrations in mg/L.
Summary of the main physical characteristics of the six catchments monitored within the Agricultural Catchments Programme. The annual average total rainfall, total river flow, runoff coefficient, mean river flow and flow “flashiness” Q10/Q90 (10th flow percentile/90th flow percentile) for data 2010–2019
| Catchment | Size [km2] | Geology | Elevation (range) [metre above sea level] | Rainfall [mm/yr] | River flow [mm/yr] | Runoff Coeff. | Mean flow [m3/s] | Q10/Q90 |
|---|---|---|---|---|---|---|---|---|
| Ballycanew | 12 | Rhyolite, Slate | 19–230 (211) | 1037 | 506 | 0.49 | 0.194 | 73 |
| Castledockerell | 11 | Slate, Siltstone | 18–215 (197) | 1015 | 528 | 0.52 | 0.188 | 26 |
| Corduff | 3 | Greywacke | 110–221 (111) | 1051 | 559 | 0.53 | 0.063 | 67 |
| Cregduff | 30 | Limestone | 27–62 (35) | 1195 | 170 | 0.14 | 0.162 | 18 |
| Dunleer | 10 | Greywacke, mudstone | 26–223 (197) | 869 | 419 | 0.48 | 0.126 | 54 |
| Timoleague | 8 | Sandstone, siltstone, mudstone | 2–122 (120) | 1100 | 679 | 0.62 | 0.163 | 27 |
Knowledge exchange occurs frequently via the specialised farm advisors, either one-to-one or in discussion groups. The programme also arranges public events and farm walks, and several research dissemination events are held annually.
The experimental design was similar across all six catchments. The biophysical and socioeconomic data collection started in 2009 and include the following:
Surface water in the catchment river outlets: river discharge (Q), electrical conductivity (EC), temperature, turbidity and nitrate-N, total reactive P (TRP), total P (TP) and total organic carbon (TOC, since 2018) concentrations (every 10 min).
Surface water in multiple sites along the river networks: nitrate-N, TP, total dissolved P (TDP), TRP, dissolved reactive P (DRP), dissolved organic carbon (DOC), EC, pH, dissolved oxygen (DO), oxidation–reduction potential (ORP), turbidity and metals (monthly).
Groundwater in focused study sites: piezo-metric water level (every 30 min), and nitrate-N, TP, TDP, DRP, DOC, EC, pH, DO, ORP, turbidity and metals sampled in multilevel monitoring wells (monthly).
A weather station is located centrally in each catchment, from which current data are publically available at www.acpmet.ie: air temperature, soil temperature, relative humidity, rain, solar radiation, wind speed/direction for estimation of potential evapotranspiration (PET) (every 10-min) and additionally, a second rain gauge located at higher ground.
Aquatic ecology is surveyed twice a year in multiple sites along the river networks: diatoms and macroinvertebrates are assessed (every May and September).
Soil sampling at the field scale (every 4 yr, maximum sampling unit 2 ha, to 0–10 cm depth): pH, liming requirement (LR), P, K and Mg content.
Land management data supplied by the DAFM are added to more detailed information collected by advisors and data recorders.
Socioeconomical and attitudinal surveys of catchment farms have been compared and supplemented with data from the National Farm Survey (NFS).
Additionally, each catchment has been surveyed for soil type, topography (LiDAR <1 m) and geology (EM3/EM37, two-dimensional resistivity, seismic refraction and ground-penetrating radar on representative fields).
Why so much data?
High-frequency monitoring of streamflow and stream water chemistry was recognised as a requirement to target the knowledge gaps for the underlying mechanisms to nutrient loss to water (Bol et al., 2018). The approach allows the capture of the full dynamics of nutrient loss to water over a year, without being skewed to specific sampling events or periods, and provides insights into water quality during both low-flow and high-flow conditions (Cassidy & Jordan 2011; Jordan et al., 2012a; Jung et al., 2020). Synchronous high-frequency water quality and discharge data provided new possibilities to analyse nutrient transfer pathways. The loadograph recession analysis was introduced to identify and quantify nutrient transfer pathways (Mellander et al., 2012a, 2012b). It was further used to detect subtle changes in water quality, needed for analysing the influences of large-scale weather systems on water quality (Mellander et al., 2018). High-frequency monitoring of hydrochemistry has also proved useful for interpreting low-frequency sampling, validating and designing sampling strategies (Cassidy et al., 2018), and to develop empirical models using low-cost surrogate variables for more costly monitoring of P concentrations (Minaudo et al., 2017) and load apportionment models based on low-frequency sampling (Crockford et al., 2017). Within the ACP the setup of high-frequency monitoring is also often used as an educational platform for visiting students, scientists and stakeholders.
Soil analysis and nutrient management
Soils are one of the fundamental elements of the experimental design in the ACP. In the context of the nutrient transfer continuum, they are both the source and a recipient of nutrients and their impact is influenced by the physical setting, land management and climate. The difference in physical and chemical properties of soils regulates the flow of water through a catchment, and the transfer of nutrients and contaminants. The soils are therefore also crucial for the mobilisation potential of nutrients in each catchment.
Spatial and temporal soil sampling
The ACP has highlighted the importance of a multi-scale monitoring approach to decrease N and P losses. These include national, catchment, farm, field and soil process scales, for a complete overview and understanding (Wall et al., 2012). Trends in soil P status, fertiliser P inputs and surplus P availability can be misrepresented at larger scales (national, catchment, farm scale) due to incomplete availability of data and information and may be better represented at smaller scales (field, soil process scale) where management and soil factors can be quantified and accounted for.
Almost the entire area (79–88%) of the ACP catchments is audited on a field scale, or at least ca. 2 ha, as a part of a soil sampling campaign, taking place approximately every 4 yr. The agronomic soil samples were collected using the standard operating protocol to the depth of 0–10 cm and analysed for the basic soil fertility status. The basic soil test includes soil pH, available P and K (Morgan’s reagent) and lime requirement.
The resulting high-resolution soil database has multiple functions in the ACP. It provides information on both nutrient use compliance regulated by the NAP and the ongoing trends in nutrient status of soils. For example, the soil data from ACP catchments showed a large spatial variability in soil test P (STP) at the farm and field scale, indicating scope to correct imbalances with better nutrient management and redistribute P to lower status soils, potentially increasing P use efficiency and decreasing P loss risk (Wall et al., 2012). Furthermore, long-term trends in soil P status supplemented by farm-gate P balances suggest that the regulations outlined in NAP have a positive effect. This was reflected in a decreased proportion of P index 4 soils (excessive P) and improvement in on-farm P use efficiency (Murphy et al., 2015). The data also show scope for improvement; however, soil P responses and trends differ between catchments and land use (McDonald et al., 2019).
The soil census data were also combined with additional studies carried out in catchments, where ancillary soil chemical and physical information provides the links relating to nutrient loss pathways to groundwater and surface waterbodies (Mellander et al., 2016; Thomas et al., 2016a, 2016b; Dupas et al., 2017) or for identification of critical source areas (CSAs) (Thomas et al., 2017).
Nutrient management planning
The multiple benefits of good soil NMP were the initial and most significant factor that encouraged farmer engagement with the programme. Results from the repeated soil analysis were used by the advisors to provide advice to farmers on baseline soil fertility and trends resulting from farm practice. When the programme started, tillage farmers showed greater interest in soil analysis results. However, the trends in soil fertility following subsequent soil sampling campaigns have improved nutrient management practice also for grassland-based sheep, beef and dairy farmers.
Schulte et al. (2010) and Wall et al. (2013) examined the predicted soil P decline expected from the implementation of a specific Water Framework Directive (WFD) measure on farms. In fields with historically high soil P concentrations and for worst case scenarios of high Total P and STP starting points, the average time to the boundary (index 3) was estimated at 7–15 yr, depending on the field P balance (Schulte et al., 2010). Using P-balance scenario deficits of −30, −15 and −7 kg P/ha, for two predominantly arable and two grassland catchments with excessive STP, Wall et al. (2013) estimated an average of 5–20 yr for agronomical optimum levels to be reached. Under the largest P deficit scenario (−30 kg P/ha), it was forecast to take between 2 and 10 yr. These studies highlight the likely time lag that exists between implementation of soil P mitigation regulations and the desired outcome of few or no fields with excessive soil P. Murphy et al. (2015) focused on the P transfer continuum in a dairy-dominated and highly stocked (catchment average of 1.94 livestock units/ha) grassland catchment with free-draining soils. Over a 3-yr period the area in P index 4 decreased by 25% and this reduction in P source pressure was made while maintaining farm productivity and with financial returns comparable to the top 10% of dairy farms nationally. This indicated that nutrient source pressure can be reduced while maintaining or improving production and profitability. In an arable catchment it was found that the actual field-scale P balances, in addition to farm-gate P balances, are required to identify pressures of P, since enhanced or maintained legacies may occur within the agricultural landscape (McDonald et al., 2019). The distribution of P across the fields was sometimes poor within farms, especially where livestock manure was the source of nutrient. There was often a mismatch between the distribution of imported manures and the crops and soil P requirements at the field scale. There is an ongoing need for improved support that can deliver better farm- and soil-specific P NMP strategies for farmers.
The ACP produced colour-coded farm maps of soil fertility levels using a geographical information system (GIS). This was the initial stage in the development of the Teagasc NMP Online (https://www.teagasc.ie/about/our-organisation/connected/online-tools/teagasc-nmp-online/), which was supported by feedback from a workshop of catchment farmers trialling the system. NMP Online has since been developed to handle a complex legislative and compliance framework that governs the management of nutrients and protection of waters. The system has grown due to increased demand from farmers and agri-consultants. There are currently more than 800 farm advisors nationwide, with over 230,000 plans on the system. The demand is further driven by policy changes from DAFM. Farmers value the benefits of optimum soil fertility and policy stakeholders have recognised the positive impacts that NMP can have on water quality. Currently 70% of the 300 ACP farmers have an “NMP Online” plan for their farm, and while a significant portion still use it for regulatory compliance reasons, the number using these plans for agronomic purposes has increased from one-third to over half. While tillage farmers are still more likely to use NMP Online for agronomic reasons, the greatest increase in this practice has taken place on grassland farms following the establishment of soil fertility trends on farms within the catchments.
Water quality
The hydrological flow paths that transfer nutrients are largely controlled by the physical settings of the agricultural landscape (Bieroza et al., 2020). The physical controls are topography, land use, soil and bedrock permeability and will influence the transfer pathways, transit times, storage and connectivity. There are also chemical and biological controls that all together influence the timing and location of nutrient delivery. The chemical controls are those affecting sorption, speciation and transformations, and the biological controls are those affecting the fixation and uptake of nutrients. Changes in drivers such as weather and agronomic pressures will further influence the dynamics and trends of nutrient loss to water and the influence of both point sources and diffuse sources of nutrients (Mellander & Jordan, 2021). There were both different magnitudes and seasonality in N and P concentrations and river discharge as monitored in the catchment outlets (Figure 2).
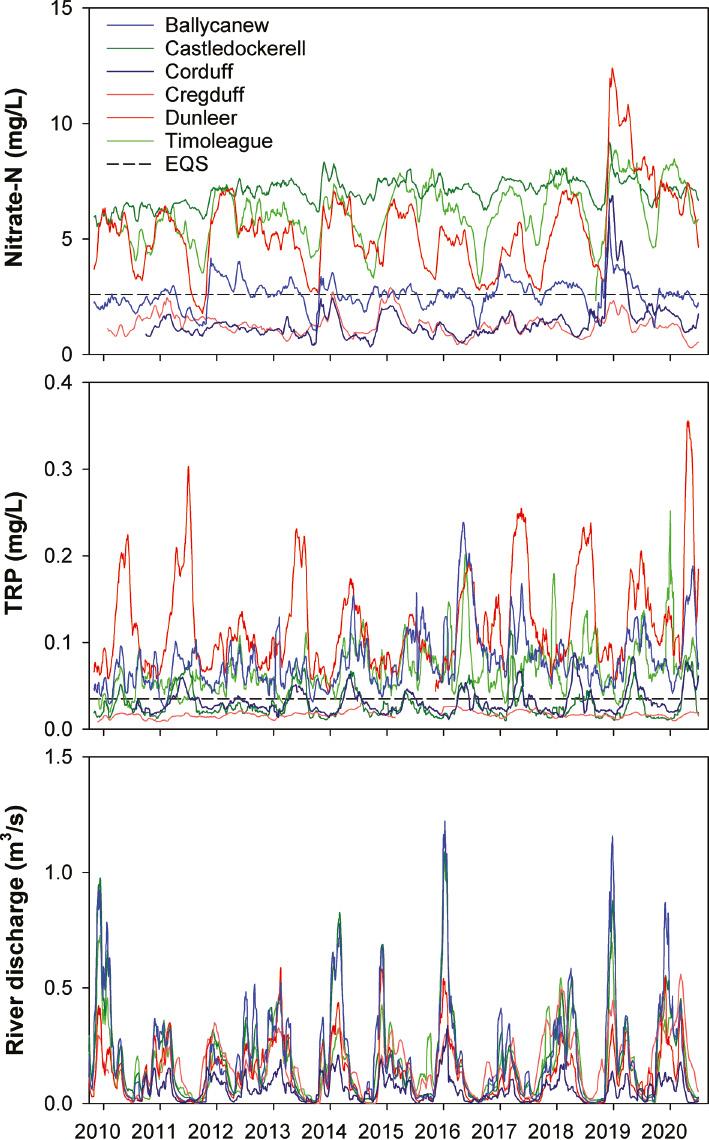
Time series of nitrate-N (NO3-N) concentration, total reactive phosphorous (TRP) concentration and river discharge monitored on a 10-min time step in the catchment river outlets for the period October 2009–September 2020. The values are expressed in monthly antecedent simple-moving averages on a daily time step. EQS = environmental quality standard, 2.60 mg/L for nitrate-N and 0.035 mg/L for TRP. Stream water total oxidized N (TON) concentration was monitored using Hach–Lange Nitratax SC-Plus UV instruments, assuming TON was equivalent to nitrate-N (Melland et al., 2012). The TRP concentration of the stream water was monitored using Dr Lange Phosphax–Sigmatax suite of instruments and the river discharge was calculated from established rating curves from water level recorded via OTT Orpheus Mini vented-pressure instruments as described in Jordan et al. (2012a).
In a homogenous landscape, the nutrient losses would hypothetically be directly reflected by the source loading. However, for the same amount of rainfall and surface area (mm and hectare), the losses of nitrate-N and TP to water over 10 yr varied highly between the six catchments. There was no clear link between nutrient source loading and nutrient mass loads leaving the catchments when normalising the mass load to both catchment area and the amount of rainfall (Figure 3). The physical setting can override the source pressure (Jordan et al., 2012b; Mellander et al., 2012a; Shore et al., 2014, 2016). There was a large difference in loss of nutrients to water due to soil drainage (Jordan et al., 2012a). A catchment with mostly poorly drained soils had three times higher total P loss, for the same stream flow, than a catchment with mostly well-drained soils, despite similar soil nutrient sources (Mellander et al., 2015). Information on land use and management may also be required to predict relative differences in particulate P concentrations during flow events (Melland et al., 2012; Shore et al., 2014). Examples of chemical controls associated with the soil chemistry as a controlling factor for P solubility and retention were also found within the ACP catchments. For example, in two mostly groundwater-fed catchments, a catchment with iron-rich soils had three times higher loss of reactive P to the stream, via leaching to shallow groundwater, than the other catchment with aluminium-rich soils (Mellander et al., 2016). The iron-rich soils encouraged P loss via a soluble form. Mobilisation processes may drive both N and P exports in groundwater-fed catchments (Dupas et al., 2017). Iron-rich soils have also been found to enhance the loss of medium-sized colloidal P (Fresne et al., 2020). In a karst spring zone catchment, with calcium- and aluminium-rich soils, P was instead largely retained and despite thin soils and numerous karst features the P loss was low and reactive P concentrations remained below the environmental quality standards (EQS) (Mellander et al., 2012b, 2013).

The annual average mass loss of nitrate-N (left panel) and total phosphorus (TP; right panel) in the catchment river outlets (2010–2019), normalised against the amount of rainfall and catchment area, plotted against the annual average stocking rate (2010–2018). The nitrate-N and TP mass loads were calculated from the concentrations and river discharge monitored on a 10-min time step in the catchment river outlets (Jordan et al., 2012a; Mellander et al., 2012a). Rainfall was monitored in the central lowland of each catchment (Mellander et al., 2012a). Stocking rates were supplied by the Department of Agriculture Food and the Marine (DAFM).
The N removal capacity also varied highly between and within two groundwater-fed catchments (McAleer et al., 2017). At the catchment scale, there was a poor link with the surplus nitrate-N leached to the groundwater and the concentrations of nitrate-N monitored in the river outlet. For example, in one of the sites the nitrate-N concentration in the shallow groundwater was locally and temporarily elevated to 23.9 mg/L due to a ploughing and pasture reseeding event. This pulse of nitrate was not detected in the stream, likely due to the locally high N removal capacity in the near-stream zone of that catchment and due to mixing of deeper groundwater (Mellander et al., 2014). Based on the dominating controls, catchments were classified into “source risky”, “mobilisation risky” or “transfer risky” in order to interpret the response to changing climate (Mellander et al., 2018). Three broad scenarios of P controls in river networks were further identified by Vero et al. (2019): i) a diffuse/groundwater pathway control with a similar P concentration across the river network, ii) an in-stream and persistent point-source control with discrepancies in water and sediment chemistry at specific locations within the river network, and iii) a mixed-control scenario.
Critical source areas
The problem of diffuse pollution can be conceptualised with a source-mobilisation-pathway-delivery model (Haygart et al., 2005), whereby the combination of high source risk areas and strong connected pathways leads to CSAs. However, identifying the locations of these areas is a key problem across different spatial scales within catchments. Defining CSAs of diffuse pollution in agricultural catchments depends upon the accurate delineation of hydrologically sensitive areas (HSAs) at highest risk of generating surface runoff pathways. An important factor is also the hydrological connectivity, and in particular at scales where CSAs can be managed (Shore et al., 2013). While ditches and drains enhance the hydrological connectivity, an understanding of their physical characteristics, spatial distribution and effect on fine sediment retention/transfer was used to develop management strategies for the reduction of downstream P transfers (Shore et al., 2015). For example, over-engineered ditches slow down water flow allowing sediments to settle. Periodic removal of fine sediment and maintenance of channel bank vegetation would then help to minimise P transfers from these catchments (Shore et al., 2015). Another approach developed within the ACP used GIS, combining digital elevation maps with information on hydrological and chemical controls. This approach could identify sub-field-scale CSAs and surface pathways of P losses and stream channels at highest risk (Thomas et al., 2016a, 2016b, 2017). Such information combined with insights into nutrient mobilisation and transfer pathways gained from methods using high-frequency hydrochemistry data could complement environmental schemes and NMP. The model has been further developed by the Environmental Protection Agency (EPA) into national CSA maps of diffuse soil P losses that quantify P loads in surface runoff (https://gis.epa.ie/EPAMaps/Water).
Critical transfer times
While targeted mitigation strategies require consideration of the spatial heterogeneity in the controls, targeted mitigation should also consider the seasonality in nutrient loss to water (Jordan et al., 2012a). A closed period for nutrient application was introduced across the Republic of Ireland in 2006 by regulation referred to as GAP. The closed period represents a 3-mo winter period critical for nutrient loss to water, as nutrient uptake by plants is low and there is a high potential for runoff due to low evapotranspiration, saturated soils and frequent rainfall. Critical times for nutrient mobilisation and transfer in runoff to streams were evaluated by Shore et al. (2016). While there was no evident pulse of increased P losses at the start of the open period, there were high P concentration events related to incidental losses from storms. Regulations were suggested to be augmented with advice on antecedent soil moisture conditions for farmers to make better decisions on the time and place to spread slurry. Nutrient concentrations in streams can also increase during low-flow periods, typically in summer when baseflow is low. This indicates point-source influences that may become disproportionate and elevate nutrient concentrations well above the EQS during a critical time for the aquatic ecology (Shore et al., 2017). A reduction in point sources is required to improve river ecological quality, and both farm and non-farm point sources should be targeted (Melland et al., 2012).
Time lags and catchments scales
Both hydrological and biogeochemical time lags occur along the nutrient transfer continuum following a change to the source of N or P. It is important to be cognisant of these delays when monitoring and assessing water quality (Vero et al., 2017, 2018). In a small karst spring zone, the hydrological time lags were months to years and the biogeochemical time lags were decades (Fenton et al., 2017). At the catchment scale of the ACP catchments, time lags generally range between 1 and 10 yr (Melland et al., 2018). The length and nature of a transport pathway are important as the residence time and biogeochemical environment will determine whether dissolved solutes, such as N and P, will be retained, transformed and/or attenuated by biogeochemical processes (Vero et al., 2019). At the catchment scale, permeability of the catchment was found to be one of the most important characteristics in understanding the time lags present. However, on smaller scales such as the meso-scale or field-scale the influence of soil type, biogeochemical processes and local weather events can dominate the impact of geology. Knowledge of the biogeochemical and meteorological processes is necessary to understand the time lags present (Mellander et al., 2018).
Climate change
Variations in weather conditions may influence how successful mitigation measures are. In the ACP catchments, there were both changes to temperature and rainfall intensity, and these are both important drivers of nutrient mobility and transfer in soils (Mellander et al., 2018; Mellander & Jordan, 2021). Also, a number of extreme weather events were observed, such as floods and droughts (Mellander & Jordan, 2021) and snow events (Vero et al., 2020). The number of extreme weather events are increasing and should be considered in nutrient mitigation strategies. An increased winter rainfall and/or reduced periodicity may provide conditions when more of the landscape and more of the nutrient sources are hydrologically connected to rivers and cause rain-induced nutrient flux. The occurrence of droughts can cause a build-up of a large soil nutrient pool due to poor plant growth and enhanced soil mineralisation. The nutrient pool can then be transferred to a river when the rain comes. Such a situation was observed in all six ACP catchments when a large pulse of nitrate-N occurred after the summer drought during the November rains in 2018 (Figure 2). The reduced stream flow during droughts can also enhance the negative influence of point-source pollution (Mellander & Jordan, 2021).
There are also long-term shifts in weather patterns, as expressed by the North Atlantic Oscillation (NAO) index, influencing both N and P concentrations in northwest (NW) Europe (Mellander et al., 2018). This can result in either exacerbating or diluting the nutrient loss to water. A clearer understanding of the combined effect of climate drivers, source management and hydrological and chemical controls in the landscape was recommended. Simplified integrated climate–hydrochemical indicators are useful for shaping future policy in managing and mitigating nutrient loss to water and can be considered at the field scale and up to the functional landscape scale (Mellander et al., 2018).
While large-scale changes by weather systems such as the NAO influence the decadal trends in nutrient concentrations in terrestrial waters (Mellander et al., 2018), short-term weather extremes may offset baseline nutrient concentrations, enhance nutrient loads and alter the type of nutrient loss risk. Strategies to mitigate nutrient loss need to consider the effects of both long-term climate changes and the more frequently occurring short-term weather impacts (Mellander & Jordan, 2021).
There were both inter-annual and inter-seasonal trends in weather parameters over a 10-yr period. The nitrate-N and P concentrations in three of the catchments were either without trend, were stable or increased, with differences between the catchments that matched the conceptual understanding. The inter-annual trends were in some cases not reflected by inter-seasonal trends and were in other cases influenced by changes in only some months of the year. Specific months may influence or even counteract the inter-annual trends (Mellander & Jordan, 2021).
Sediment loss and aquatic ecology
The key controls for suspended sediment transport are soil type and land use. For example, arable farming on low permeability soils was particularly prone to sediment loss (Sherriff et al., 2019). The pathway for this transport was primarily through surface runoff driven by rainfall events, and thus catchment soil erosion risk can be classified according to soil drainage characteristics and land-use type (Sherriff et al., 2019). Suspended sediment export from five of the six ACP catchments was low in comparison to values for the UK and mainland Europe. This is likely due to greater density of landscape features such as hedgerows and drainage ditches which reduced field sizes and act as natural mitigation measures reducing the velocity of surface flow and thus the kinetic energy available to mobilise and transport suspended sediments (Sherriff et al., 2015). Assessment of the origins of suspended sediments found that field top soils, channel banks and roads were particularly vulnerable to sediment erosion in ACP catchments (Sherriff et al., 2018).
Deposited fine sediment was found to be the most pervasive stressor in the ACP catchments, confirming a growing number of studies in Ireland which have highlighted suspended sediment as posing a significant risk to macroinvertebrate communities in agricultural streams (Davis et al. 2018, 2019). Suspended sediment loads were associated with greater stress to macroinvertebrates than either N or P concentrations, although the negative influences of suspended sediment loads were exacerbated by the presence of elevated N and P concentrations (Davis et al., 2019).
Emerging contaminants
Modern agricultural practices include the use of agrochemicals such as pesticides and pharmaceuticals. In Ireland, the phenoxy herbicide MCPA (2-methyl-4-chlorophenoxyacetic acid) is frequently used to reduce and inhibit rush (Juncus spp.) cover on grasslands and certain broadleaf weed species (Morton et al., 2020). The compound is highly susceptible to contaminate both surface and groundwater due to its high water solubility and low soil adsorption. While legislative steps have been taken to govern the control and use of pesticides, the national monitoring of drinking water resources has shown an increase in the number of public water supplies that are failing to meet the legislative standards (EPA, 2017). In Irish groundwater bodies, there were more pesticide metabolites present than the parent active ingredients themselves (McManus et al., 2017). Morton et al. (2020) identified a need for more knowledge on mobilisation and transfer processes of MCPA to be able to identify mitigation and treatment measures. Acid herbicides were detected in private drinking water wells (some exceeded recommendations) and were present in the rivers all year in two hydrologically contrasting catchments within the ACP, even though these areas are not associated with herbicide pollution in water. While the concentrations peaked in summer, associated with land application and low river flow, the mass loads were higher in winter suggesting restricted degradation and persistence of the herbicides in the soil, sub-surface and sediments (Khan et al., 2020). McGrath et al. (2019) recognised that for better management of surface and groundwater, it is useful to be able to forecast pesticide residues in soils in real time and developed a new stochastic model developed to account for rainfall variability after application.
For the first time, a newly developed and comprehensive analytical procedure (Mooney et al., 2019, 2020a) allowed for an extensive assessment of pharmaceuticals and transformation products in Irish groundwater (Mooney et al., 2020b, 2021). The occurrence of anti-coccidial veterinary drugs, mainly from poultry activity, was found to be the contaminant of concern for groundwater (Mooney et al., 2021). Also anthelmintic, anti-parasitic veterinary drugs were frequently detected in groundwater and transformation products were more prevalent in groundwater than in surface waters. Temporal variations, likely linked to drug usage and weather, were observed in karst springs. This clearly demonstrates the requirement for a safe use also of pharmaceuticals.
Catchment economics and socioeconomy
Indicators of environmental sustainability
Data from the Teagasc NFS were used for socioeconomic research during the early stages of the ACP, while farmer engagement was being developed. A series of farm-level sustainability indicators for Ireland were developed using data from the Teagasc NFS. Four dimensions, reflecting the multifaceted nature of sustainability, economic, environmental, and social and innovation were included. Indicators around the sustainable use of N and P at farm level were further developed and showed an average N and P use efficiency of 36.7% and 79.6%, respectively, across all farm systems (including tillage) (Buckley et al., 2015a).
Further studies estimated farm-gate N balance and use efficiency across 150 dairy farms in the NFS over the period 2006–2012. The N balance declined by 25.1 kg/ha from 180.4 to 155.3 kg/ha over the study period. This was attributable to reduced chemical N fertiliser inputs of 23.1 kg/ha. Nitrogen use efficiency improved by 2.1% over the period from 20.8% to 22.9%. Nitrogen balance and use efficiency were significantly influenced by factors such as fertiliser prices, stocking rate, land-use potential, contact with extension services and climatic variables (Buckley et al., 2016a). For the same period, farm-gate P balance and use efficiency were estimated across 150 dairy farms in the NFS. The P balance declined by 50% from 11.9 to 6.0 kg/ha. The decline was caused by reduced chemical P fertiliser inputs of 6.5 kg/ha. However, P use efficiency improved by 18% from 60% to 78%. The P balance and use efficiency were found to be significantly influenced by factors such as fertiliser prices, stocking rate, land-use potential, use of milk recording technology, contact with extension services and rainfall patterns (Buckley et al., 2016b).
The role of efficiency in the utilisation of N and P applications was found to have a positive effect on both environmental and economic returns to the farm. The average over-application of chemical fertilisers ranged from 22.8 to 32.8 kg N/ha and 2.9 to 3.5 kg P/ha in 2008, which were the same or greater than the losses to leaching and runoff for N and P from similar intensive agricultural land uses. Potential cost savings on chemical fertilisers across all farm systems ranged on average from €38.9/ha to €48.5/ha. Potential cost reductions on imported feeds of €65 to €84 per livestock unit were indicated for the dairy farms in the study versus efficient benchmark farms. Average excess of imported feedstuffs equated to 5.82–7.44 kg/LU of N and 0.92–1.17 kg/LU of P. Such reductions have the potential to deliver a double dividend by reducing the risk of diffuse nutrient losses from agricultural land while improving economic margins at farm level (Buckley & Carney, 2013).
In the current phase of the ACP, two data recorders are using NFS protocols to collect socioeconomic data from catchment farms. This will enable comparisons with the national data set, and substantiate the sustainability indicators against the biophysical environmental monitoring in the programme.
Farmers attitude and behaviour
To investigate farmer subjective opinions on the implementation of the EU ND, a Q methodology was used. Results indicated four main opinion groups, and while farmers were sceptical of the validity of certain NAP measures, there was a growing acceptance among some farmers of environmental benefits accruing from the regulation (Buckley, 2012). Research has also shown that farmer motivations play a role in the adoption of nutrient management best practice. Specifically, farmers classified by “farm stewardship”, “ecocentric” and “productivist” considerations were more likely to adopt a greater number of the nutrient management best practices. Demographic and structural variables such as age, off-farm employment status and contact with extension services were found to be significantly related to the probability of adoption of nutrient management practices examined (Buckley et al., 2015b).
Public preference for good water quality (WFD objectives) was evaluated by asking 650 adults how much of a tax increase would they be willing to pay (WTP) to get all rivers in Ireland up to the standard required for the WFD, having been previously given a background to the WFD and water quality in Ireland. Mean WTP was €19 per respondent per annum and was influenced by their social class, perception of household financial status, education, amount of water way recreational use, personal environmental values/apathy and which river basin district they lived in (Buckley et al., 2016c).
Uptake of mitigation measures
In a survey of all catchments, 53% of the farmers indicated a negative preference for provision of a fenced 10-m riparian buffer zone under a 5 yr scheme. Willingness to adopt the proposed buffer zone was influenced by the economic, attitudinal and farm structural factors. The mean payment required by those willing to adopt the measure was estimated at €1.51/m of linear stream reach (Buckley et al., 2012). National survey data showed that 9–15% of farmers nationally would be WTP for poultry and pig manures and a further 17–28% would import manure if offered it on a free-of-charge basis. The demand for these manures is strongest among arable farmers, younger farmer cohorts and those of larger farm size with greater expenditure on chemical fertilisers (Buckley & Fealy, 2012).
A technology acceptance model (TAM) was used to investigate the key factors which influence farmer adoption of an online NMP. The TAM identifies two psychological constructs, perceived usefulness (PU) and perceived ease of use (PEOU), which are believed to be key factors in technology adoption. Results indicate that PU and PEOU of an NMP are positively and significantly related to a farmer’s intention to adopt and use the technology in the future. However, PU, which captures the perceived benefits in terms of usefulness, is the main driver of technology adoption (McCormack & Buckley, 2018). There were difficulties involved in the implementation of agri-environmental policies due the variety of actors involved. A participatory approach, including stakeholders with conflicting interests, was used to select P transfer mitigation policies. Stakeholders were found to be diverse, and perceived effectiveness is based on group-specific operational and social factors. There was also a need for integration of conflicting opinions in policy design, and a bottom-up approach to decision making. Improved KT is also required between interested actors (Micha et al., 2018).
Knowledge exchange and stakeholder engagement
The ACP advisors provide a service to all farmers with land in the catchment, regardless of enterprise type. Most of the advisors’ contact with clients is one-to-one, through on-farm visits, consultations and phone calls concerning all aspects of the farm business and not just water quality and soil fertility issues. Advice is provided on farm husbandry, production, schemes, regulatory compliance and financial performance. In addition to one-to-one advice, the ACP advisors also facilitate discussion groups attended by farmers from the catchments. This can be a very effective and efficient method of KT, but it is important to be aware that many farmers are not members of such groups. Farmer engagement in the ACP would not be at the level it is if the advisory services were limited to catchment science and water quality issues alone. The good advisor–client relationship is evident in the number of ACP farms that have facilitated research through siting of monitoring and experimental sites, and even suggesting research topics applicable to the NAP review. In addition, the broad focus of the advisory service facilitates the collection of environmental, economic and production data from the farms.
The meteorological data collected for research from the seven automated weather stations within the catchments generate interest from farmers local to the catchment areas. Current weather information for each of the catchments, updated every hour, is now publicly available online (www.acpmet.ie). These data support decision making on timing of nutrient application, improving agronomic response and reducing the risk of loss. Avoiding early nitrogen applications when soil temperatures are below that required for appreciable grass growth (6°C) is an example. Localised weather forecast provided by Met Éireann has been added to the web site, further aiding farming decisions. There are typically between 200 and 400 page views per wk, but during the month of February decisions are being made on when to first apply N, and page views increase to between 400 and 500.
The role of catchment advisors is also to disseminate research generated by the programme to the wider farmer audience and other stakeholders. Visiting farmer discussion groups are regularly hosted by the ACP across all six catchments. Ideally, the group will visit a catchment with similar farming systems and/or water quality issues to their own farms. This ensures a focused and topical discussion. Other KT activities include presentations to visiting third-level college courses, agricultural students, farmer courses, policy agencies and researchers. Findings from the ACP are also disseminated through scientific journals, popular press, radio interviews, Twitter and YouTube.
Extended baseline monitoring and catchment modelling
The baseline data collection in the ACP has in its current phase been extended to align with the WFD and include measurements of greenhouse gas (GHG), ammonia emissions and soil carbon sequestration across the catchments.
Eddy covariance towers (ECTs) will be deployed in the catchments to provide in situ, high-resolution (10 Hz) measurement of carbon dioxide (CO2), water vapour (H2O) and methane (CH4) in air. The main objectives will be to examine long-term (>4 yrs) GHG fluxes for different land uses (arable and grassland) as well as examine how soil drainage, management practices, land-use change and climatic drivers impact on the magnitude of GHG fluxes.
Monitoring of ammonia (NH3) will be conducted using ALPHA (Adapted Low-cost Passive High Absorption) and DELTA (DEnuder for Long-Term Atmospheric sampling) methods. The monitoring will be conducted at the ACP catchment scale and samplers will be spatially distributed to provide a representative concentration of NH3 within a specific catchment. For a better understanding of the impact of farm management practices on NH3 loss, the emissions of NH3 will be modelled.
Measurement of soil organic carbon (SOC) will be quantified in chronosequences at each ECT site: ≥0.5 m depth at various incremental depths (e.g. every 10 cm) and corrected to the equivalent soil mass. This combined soil-core analysis with ECT flux measurements approach will help to quantify how much carbon is transferred from plants (root and shoot litter) to soil organic matter and elucidate the mechanisms responsible for C stabilisation in agricultural soils.
To advance the research priorities of the ACP, a comprehensive set of modelling objectives have been established. These objectives include the selection, development and adaptation of catchment models to simulate fluxes from both higher-stocking-rate and lower-stocking-rate farms. Once baseline models have been developed, models will be up-scaled to larger catchments, river basin districts and the national level. Finally, the models will be utilised to test environmental impacts of future agricultural, regulatory and climate scenarios, to facilitate sustainable farming practices.
A two-track modelling strategy is being developed. In the first track, hydrologic modelling frameworks are being explored, as a means of adopting a flexible methodology to modelling. This will allow models to be constructed in a modular way, where the model complexity can be increased (or decreased) as required to simulate the target catchment. This allows us to tailor the models at each catchment to represent the different dominant hydrologic processes, and to better control and quantify model uncertainty at each step of increasing complexity. Over the last decade, a range of different modelling frameworks have been developed, such as Catchment Modelling Framework (CMF) (Kraft et al., 2011), Structure for Unifying Multiple Modelling Alternatives (SUMMA) (Clark et al., 2015), Raven (Craig et al., 2020) and Mobius (Norling et al., 2021). These frameworks all have similar conceptual underpinnings, but vary in their relative strengths and weakness, which are currently being reviewed with respect to suitability to the ACP modelling programme. The second track is focused on the use of established “stand alone” models, where models capable of simulating fluxes across the soil–water–atmosphere system at the catchment scale will be tested and applied. The advantage of this approach is that models can be applied relatively quickly at the larger catchment/basin scale for purposes such as scenario testing (e.g. climate scenarios, BMP implementation). A wide range of established hydrologic models will be explored, which may provide a good representation of catchment processes.
Conclusions
Using a holistic approach of agro-environmental studies in six ca. 10 km2 river catchments, the ACP has provided research for an improved process-based understanding of nutrient loss to water in heterogeneous agricultural landscapes, under changing weather patterns and intensified agriculture. The research provided ongoing support for environmental schemes and NMP. In its current phase the ACP combines monitoring of water quality, GHGs, ammonia, soil C sequestration and socioeconomy all in one programme, in order to facilitate sustainable farming practices. Some key findings are listed below:
Catchment controls can override nutrient source pressures. There was no clear link between stream N and P concentrations and nutrient loading at small catchments scale. Targeted and efficient mitigation measures are required.
In some catchments, long-term weather shifts, as expressed by the NAO, influence both N and P concentrations in the catchment rivers. The catchments respond differently to these changes depending on their physical and chemical settings.
Weather changes can override trends of source pressures. Both long-term weather shifts and short-term weather shocks need consideration and may require different mitigation strategies.
There are time lags between agricultural pressures and water quality state. The response time mostly increases with catchment size. Time lags need consideration when linking agricultural pressure to water quality state.
Spatiotemporal information on pathways and delivery sites can facilitate targeted and efficient mitigation measures to encompass the impact of climate change. Results from the ACP can provide transferable information to scale up to larger areas.
Following heavy rainfall, stream P concentrations were gradually reduced during the “closed period” for spreading organic manures. Storm P concentrations did not increase in the 4-wk period after the end of the “closed period”. Advice on soil moisture conditions can facilitate better decisions on time and location for slurry spreading.
Most of the sediment losses came from stream bank/bed erosion and road losses on the more common land uses. Soil permeability largely influenced the sediment loss.
Sediment was the most pervasive stressor on stream macroinvertebrate communities. Improving river ecological quality requires improved management of sediment inputs and influence of point sources in low flow.
Safe use of pesticides and pharmaceuticals is required. Herbicides were detected in private drinking water wells and were present in the rivers all year: concentrations peaked in summer and mass loads in winter. Anti-coccidial veterinary drugs and anthelmintic residues were detected in groundwater. There is a need to identify mitigation measures and/or alternative treatments.
There is room for improvement in reaching agronomical/environmental goals. The distribution of P sources can be improved. At the field scale, there was often a mismatch between P inputs and the crop/soil P requirements. There is a need for improved support to knowledge exchange mechanisms that can deliver better farm- and soil-specific NMP strategies.
The role of efficiency in the utilisation of N and P applications has a positive effect on both environmental and economic returns to a farm.
A growing acceptance of environmental benefits from regulation was found. The likelihood of adopting certain nutrient management practice is related to demographic and farm structural factors.
Economic, attitudinal and farm structural factors influence the willingness to adopt a mitigation measure such as a buffer zone.
Knowledge exchange is required for effective NMP. Farmers prefer a flexible NMP approach combining a durable map with a table. Factors such as fertiliser prices, stocking rates, land-use potential, use of milk recording technology, contact with extension services and rainfall patterns influence the P balance and use efficiency. Advisory support is required.