23
views
0
recommends
+1 Recommend
0 collections
    0
    shares
      • Record: found
      • Abstract: found
      • Article: found
      Is Open Access

      Triglyceride-glucose index variability and incident cardiovascular disease: a prospective cohort study

      research-article

      Read this article at

      Bookmark
          There is no author summary for this article yet. Authors can add summaries to their articles on ScienceOpen to make them more accessible to a non-specialist audience.

          Abstract

          Background

          Recent studies have suggested that triglyceride-glucose (TyG) index is an independent predictor of cardiovascular disease (CVD). However, the impact of long-term visit-to-visit variability in TyG index on the risk of CVD is not known. We aimed to investigate the longitudinal association between baseline and mean TyG index as well as TyG index variability and incident CVD in a Chinese population.

          Methods

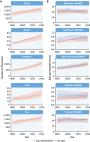
          We included 49,579 participants without previous history of CVD in the Kailuan study who underwent three health examinations (2006, 2008, and 2010) and were followed up for clinical events until 2019. TyG index was calculated as Ln [fasting triglyceride (mg/dL) × fasting glucose (mg/dL)/2]. We measured TyG index variability as the SD of the residuals obtained from a linear regression on the three TyG index measurements for each individual. Multivariate-adjusted Cox models were used to estimate the adjusted hazard ratio (aHR) and 95% confidence interval (CI) with incident CVD.

          Results

          During a median follow-up time of 9.0 years, 2404 developed CVD. The highest tertile (T3) of baseline and mean TyG index were each associated with higher CVD incidence as compared with the lowest tertile (T1): aHR, 1.25; 95% CI 1.11–1.42; and aHR 1.40; 95% CI 1.24–1.58, respectively. Tertile 3 of TyG index variability was associated with increased CVD incidence compared to T1 group (aHR, 1.12; 95% CI 1.01–1.24). Similar findings were observed in a series of sensitivity analyses.

          Conclusion

          Higher TyG index level and greater TyGindex variability were each independently associated with a higher incidence of CVD.

          Supplementary Information

          The online version contains supplementary material available at 10.1186/s12933-022-01541-5.

          Related collections

          Most cited references40

          • Record: found
          • Abstract: found
          • Article: not found

          A new equation to estimate glomerular filtration rate.

          Equations to estimate glomerular filtration rate (GFR) are routinely used to assess kidney function. Current equations have limited precision and systematically underestimate measured GFR at higher values. To develop a new estimating equation for GFR: the Chronic Kidney Disease Epidemiology Collaboration (CKD-EPI) equation. Cross-sectional analysis with separate pooled data sets for equation development and validation and a representative sample of the U.S. population for prevalence estimates. Research studies and clinical populations ("studies") with measured GFR and NHANES (National Health and Nutrition Examination Survey), 1999 to 2006. 8254 participants in 10 studies (equation development data set) and 3896 participants in 16 studies (validation data set). Prevalence estimates were based on 16,032 participants in NHANES. GFR, measured as the clearance of exogenous filtration markers (iothalamate in the development data set; iothalamate and other markers in the validation data set), and linear regression to estimate the logarithm of measured GFR from standardized creatinine levels, sex, race, and age. In the validation data set, the CKD-EPI equation performed better than the Modification of Diet in Renal Disease Study equation, especially at higher GFR (P < 0.001 for all subsequent comparisons), with less bias (median difference between measured and estimated GFR, 2.5 vs. 5.5 mL/min per 1.73 m(2)), improved precision (interquartile range [IQR] of the differences, 16.6 vs. 18.3 mL/min per 1.73 m(2)), and greater accuracy (percentage of estimated GFR within 30% of measured GFR, 84.1% vs. 80.6%). In NHANES, the median estimated GFR was 94.5 mL/min per 1.73 m(2) (IQR, 79.7 to 108.1) vs. 85.0 (IQR, 72.9 to 98.5) mL/min per 1.73 m(2), and the prevalence of chronic kidney disease was 11.5% (95% CI, 10.6% to 12.4%) versus 13.1% (CI, 12.1% to 14.0%). The sample contained a limited number of elderly people and racial and ethnic minorities with measured GFR. The CKD-EPI creatinine equation is more accurate than the Modification of Diet in Renal Disease Study equation and could replace it for routine clinical use. National Institute of Diabetes and Digestive and Kidney Diseases.
            Bookmark
            • Record: found
            • Abstract: found
            • Article: found
            Is Open Access

            Global Burden of Cardiovascular Diseases and Risk Factors, 1990–2019

            Cardiovascular diseases (CVDs), principally ischemic heart disease (IHD) and stroke, are the leading cause of global mortality and a major contributor to disability. This paper reviews the magnitude of total CVD burden, including 13 underlying causes of cardiovascular death and 9 related risk factors, using estimates from the Global Burden of Disease (GBD) Study 2019. GBD, an ongoing multinational collaboration to provide comparable and consistent estimates of population health over time, used all available population-level data sources on incidence, prevalence, case fatality, mortality, and health risks to produce estimates for 204 countries and territories from 1990 to 2019. Prevalent cases of total CVD nearly doubled from 271 million (95% uncertainty interval [UI]: 257 to 285 million) in 1990 to 523 million (95% UI: 497 to 550 million) in 2019, and the number of CVD deaths steadily increased from 12.1 million (95% UI:11.4 to 12.6 million) in 1990, reaching 18.6 million (95% UI: 17.1 to 19.7 million) in 2019. The global trends for disability-adjusted life years (DALYs) and years of life lost also increased significantly, and years lived with disability doubled from 17.7 million (95% UI: 12.9 to 22.5 million) to 34.4 million (95% UI:24.9 to 43.6 million) over that period. The total number of DALYs due to IHD has risen steadily since 1990, reaching 182 million (95% UI: 170 to 194 million) DALYs, 9.14 million (95% UI: 8.40 to 9.74 million) deaths in the year 2019, and 197 million (95% UI: 178 to 220 million) prevalent cases of IHD in 2019. The total number of DALYs due to stroke has risen steadily since 1990, reaching 143 million (95% UI: 133 to 153 million) DALYs, 6.55 million (95% UI: 6.00 to 7.02 million) deaths in the year 2019, and 101 million (95% UI: 93.2 to 111 million) prevalent cases of stroke in 2019. Cardiovascular diseases remain the leading cause of disease burden in the world. CVD burden continues its decades-long rise for almost all countries outside high-income countries, and alarmingly, the age-standardized rate of CVD has begun to rise in some locations where it was previously declining in high-income countries. There is an urgent need to focus on implementing existing cost-effective policies and interventions if the world is to meet the targets for Sustainable Development Goal 3 and achieve a 30% reduction in premature mortality due to noncommunicable diseases.
              Bookmark
              • Record: found
              • Abstract: found
              • Article: not found

              Sensitivity Analysis in Observational Research: Introducing the E-Value.

              Sensitivity analysis is useful in assessing how robust an association is to potential unmeasured or uncontrolled confounding. This article introduces a new measure called the "E-value," which is related to the evidence for causality in observational studies that are potentially subject to confounding. The E-value is defined as the minimum strength of association, on the risk ratio scale, that an unmeasured confounder would need to have with both the treatment and the outcome to fully explain away a specific treatment-outcome association, conditional on the measured covariates. A large E-value implies that considerable unmeasured confounding would be needed to explain away an effect estimate. A small E-value implies little unmeasured confounding would be needed to explain away an effect estimate. The authors propose that in all observational studies intended to produce evidence for causality, the E-value be reported or some other sensitivity analysis be used. They suggest calculating the E-value for both the observed association estimate (after adjustments for measured confounders) and the limit of the confidence interval closest to the null. If this were to become standard practice, the ability of the scientific community to assess evidence from observational studies would improve considerably, and ultimately, science would be strengthened.
                Bookmark

                Author and article information

                Contributors
                drwusl@163.com
                wanganxin@bjtth.org
                Journal
                Cardiovasc Diabetol
                Cardiovasc Diabetol
                Cardiovascular Diabetology
                BioMed Central (London )
                1475-2840
                10 June 2022
                10 June 2022
                2022
                : 21
                : 105
                Affiliations
                [1 ]GRID grid.24696.3f, ISNI 0000 0004 0369 153X, Department of Cardiac Surgery, Heart Center & Beijing Key Laboratory of Hypertension, Beijing Chaoyang Hospital, , Capital Medical University, ; Beijing, China
                [2 ]GRID grid.24696.3f, ISNI 0000 0004 0369 153X, Beijing Advanced Innovation Center for Big Data-Based Precision Medicine, , Capital Medical University, ; Beijing, China
                [3 ]GRID grid.24696.3f, ISNI 0000 0004 0369 153X, Department of Neurology, Beijing Tiantan Hospital, , Capital Medical University, ; Beijing, China
                [4 ]GRID grid.24696.3f, ISNI 0000 0004 0369 153X, China National Clinical Research Center for Neurological Diseases, Beijing Tiantan Hospital, , Capital Medical University, ; Beijing, China
                [5 ]GRID grid.24696.3f, ISNI 0000 0004 0369 153X, Department of Epidemiology and Health Statistics, School of Public Health, , Capital Medical University, ; Beijing, China
                [6 ]GRID grid.38142.3c, ISNI 000000041936754X, Department of Medicine, Beth Israel Deaconess Medical Center, , Harvard Medical School, ; Boston, MA USA
                [7 ]GRID grid.440734.0, ISNI 0000 0001 0707 0296, Department of Cardiology, Kailuan Hospital, , North China University of Science and Technology, ; Tangshan, China
                [8 ]GRID grid.1018.8, ISNI 0000 0001 2342 0938, Department of Mathematics and Statistics, , La Trobe University, ; Melbourne, VIC Australia
                Author information
                http://orcid.org/0000-0001-7095-6022
                http://orcid.org/0000-0003-4351-2877
                Article
                1541
                10.1186/s12933-022-01541-5
                9188105
                35689232
                f7aa004f-3d0c-4411-8a8e-b60940f423f4
                © The Author(s) 2022

                Open AccessThis article is licensed under a Creative Commons Attribution 4.0 International License, which permits use, sharing, adaptation, distribution and reproduction in any medium or format, as long as you give appropriate credit to the original author(s) and the source, provide a link to the Creative Commons licence, and indicate if changes were made. The images or other third party material in this article are included in the article's Creative Commons licence, unless indicated otherwise in a credit line to the material. If material is not included in the article's Creative Commons licence and your intended use is not permitted by statutory regulation or exceeds the permitted use, you will need to obtain permission directly from the copyright holder. To view a copy of this licence, visit http://creativecommons.org/licenses/by/4.0/. The Creative Commons Public Domain Dedication waiver ( http://creativecommons.org/publicdomain/zero/1.0/) applies to the data made available in this article, unless otherwise stated in a credit line to the data.

                History
                : 23 April 2022
                : 30 May 2022
                Funding
                Funded by: National Natural Science Foundation of China
                Award ID: 8210120410
                Award Recipient :
                Funded by: Golden Seed Program of Beijing Chaoyang Hospital
                Award ID: CYJZ202101
                Award Recipient :
                Funded by: Beijing Municipal Administration of Hospitals Incubating Program
                Award ID: PX2020021
                Award Recipient :
                Funded by: National Key R&D Program of China
                Award ID: 2018YFC1312400
                Award Recipient :
                Funded by: Beijing Excellent Talents Training Program
                Award ID: 2018000021469G234
                Award Recipient :
                Categories
                Research
                Custom metadata
                © The Author(s) 2022

                Endocrinology & Diabetes
                triglyceride-glucose index,cardiovascular disease,variability,cohort study

                Comments

                Comment on this article