3
views
0
recommends
+1 Recommend
2 collections
    0
    shares

      Submit your digital health research with an established publisher
      - celebrating 25 years of open access

      • Record: found
      • Abstract: found
      • Article: found
      Is Open Access

      Exploring the Utility of Google Mobility Data During the COVID-19 Pandemic in India: Digital Epidemiological Analysis

      research-article

      Read this article at

      ScienceOpenPublisherPMC
      Bookmark
          There is no author summary for this article yet. Authors can add summaries to their articles on ScienceOpen to make them more accessible to a non-specialist audience.

          Abstract

          Background

          Association between human mobility and disease transmission has been established for COVID-19, but quantifying the levels of mobility over large geographical areas is difficult. Google has released Community Mobility Reports (CMRs) containing data about the movement of people, collated from mobile devices.

          Objective

          The aim of this study is to explore the use of CMRs to assess the role of mobility in spreading COVID-19 infection in India.

          Methods

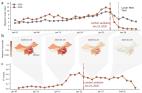
          In this ecological study, we analyzed CMRs to determine human mobility between March and October 2020. The data were compared for the phases before the lockdown (between March 14 and 25, 2020), during lockdown (March 25-June 7, 2020), and after the lockdown (June 8-October 15, 2020) with the reference periods (ie, January 3-February 6, 2020). Another data set depicting the burden of COVID-19 as per various disease severity indicators was derived from a crowdsourced API. The relationship between the two data sets was investigated using the Kendall tau correlation to depict the correlation between mobility and disease severity.

          Results

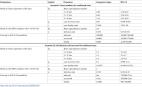
          At the national level, mobility decreased from –38% to –77% for all areas but residential (which showed an increase of 24.6%) during the lockdown compared to the reference period. At the beginning of the unlock phase, the state of Sikkim (minimum cases: 7) with a –60% reduction in mobility depicted more mobility compared to –82% in Maharashtra (maximum cases: 1.59 million). Residential mobility was negatively correlated (–0.05 to –0.91) with all other measures of mobility. The magnitude of the correlations for intramobility indicators was comparatively low for the lockdown phase (correlation ≥0.5 for 12 indicators) compared to the other phases (correlation ≥0.5 for 45 and 18 indicators in the prelockdown and unlock phases, respectively). A high correlation coefficient between epidemiological and mobility indicators was observed for the lockdown and unlock phases compared to the prelockdown phase.

          Conclusions

          Mobile-based open-source mobility data can be used to assess the effectiveness of social distancing in mitigating disease spread. CMR data depicted an association between mobility and disease severity, and we suggest using this technique to supplement future COVID-19 surveillance.

          Related collections

          Most cited references60

          • Record: found
          • Abstract: found
          • Article: found
          Is Open Access

          The effect of human mobility and control measures on the COVID-19 epidemic in China

          The ongoing COVID-19 outbreak expanded rapidly throughout China. Major behavioral, clinical, and state interventions have been undertaken to mitigate the epidemic and prevent the persistence of the virus in human populations in China and worldwide. It remains unclear how these unprecedented interventions, including travel restrictions, affected COVID-19 spread in China. We use real-time mobility data from Wuhan and detailed case data including travel history to elucidate the role of case importation on transmission in cities across China and ascertain the impact of control measures. Early on, the spatial distribution of COVID-19 cases in China was explained well by human mobility data. Following the implementation of control measures, this correlation dropped and growth rates became negative in most locations, although shifts in the demographics of reported cases were still indicative of local chains of transmission outside Wuhan. This study shows that the drastic control measures implemented in China substantially mitigated the spread of COVID-19.
            Bookmark
            • Record: found
            • Abstract: found
            • Article: found
            Is Open Access

            Data-based analysis, modelling and forecasting of the COVID-19 outbreak

            Since the first suspected case of coronavirus disease-2019 (COVID-19) on December 1st, 2019, in Wuhan, Hubei Province, China, a total of 40,235 confirmed cases and 909 deaths have been reported in China up to February 10, 2020, evoking fear locally and internationally. Here, based on the publicly available epidemiological data for Hubei, China from January 11 to February 10, 2020, we provide estimates of the main epidemiological parameters. In particular, we provide an estimation of the case fatality and case recovery ratios, along with their 90% confidence intervals as the outbreak evolves. On the basis of a Susceptible-Infectious-Recovered-Dead (SIDR) model, we provide estimations of the basic reproduction number (R 0), and the per day infection mortality and recovery rates. By calibrating the parameters of the SIRD model to the reported data, we also attempt to forecast the evolution of the outbreak at the epicenter three weeks ahead, i.e. until February 29. As the number of infected individuals, especially of those with asymptomatic or mild courses, is suspected to be much higher than the official numbers, which can be considered only as a subset of the actual numbers of infected and recovered cases in the total population, we have repeated the calculations under a second scenario that considers twenty times the number of confirmed infected cases and forty times the number of recovered, leaving the number of deaths unchanged. Based on the reported data, the expected value of R 0 as computed considering the period from the 11th of January until the 18th of January, using the official counts of confirmed cases was found to be ∼4.6, while the one computed under the second scenario was found to be ∼3.2. Thus, based on the SIRD simulations, the estimated average value of R 0 was found to be ∼2.6 based on confirmed cases and ∼2 based on the second scenario. Our forecasting flashes a note of caution for the presently unfolding outbreak in China. Based on the official counts for confirmed cases, the simulations suggest that the cumulative number of infected could reach 180,000 (with a lower bound of 45,000) by February 29. Regarding the number of deaths, simulations forecast that on the basis of the up to the 10th of February reported data, the death toll might exceed 2,700 (as a lower bound) by February 29. Our analysis further reveals a significant decline of the case fatality ratio from January 26 to which various factors may have contributed, such as the severe control measures taken in Hubei, China (e.g. quarantine and hospitalization of infected individuals), but mainly because of the fact that the actual cumulative numbers of infected and recovered cases in the population most likely are much higher than the reported ones. Thus, in a scenario where we have taken twenty times the confirmed number of infected and forty times the confirmed number of recovered cases, the case fatality ratio is around ∼0.15% in the total population. Importantly, based on this scenario, simulations suggest a slow down of the outbreak in Hubei at the end of February.
              Bookmark
              • Record: found
              • Abstract: found
              • Article: not found

              Strategies for mitigating an influenza pandemic

              Pandemic flu: talking tactics Numerical models of the epidemiology of a potential flu pandemic show there is no single magic bullet which can control the outbreak, but that a combination of approaches could reduce transmission and save many lives. Border restrictions are unlikely to have much effect and travel restrictions within one country would make very little difference to the spread of a pandemic within that country. The models predict that a pandemic in the United Kingdom would peak within two to three months of the first case, and be over within 4 months. It also shows that vaccines need to be available within two months of the start of a pandemic to have a big effect in reducing infection rates. That means that vaccines would need to be stockpiled in advance to be effective. Supplementary information The online version of this article (doi:10.1038/nature04795) contains supplementary material, which is available to authorized users.
                Bookmark

                Author and article information

                Contributors
                Journal
                JMIR Public Health Surveill
                JMIR Public Health Surveill
                JPH
                JMIR Public Health and Surveillance
                JMIR Publications (Toronto, Canada )
                2369-2960
                August 2021
                30 August 2021
                30 August 2021
                : 7
                : 8
                : e29957
                Affiliations
                [1 ] Postgraduate Institute of Medical Education and Research Chandigarh India
                [2 ] Mehr Chand Mahajan DAV College Chandigarh India
                [3 ] All India Institute of Medical Sciences Bathinda India
                Author notes
                Corresponding Author: Madhur Verma drmadhurverma@ 123456gmail.com
                Author information
                https://orcid.org/0000-0001-8936-0843
                https://orcid.org/0000-0002-8914-4283
                https://orcid.org/0000-0002-1787-8392
                https://orcid.org/0000-0002-3720-5742
                Article
                v7i8e29957
                10.2196/29957
                8407437
                34174780
                f7569164-1562-4209-8679-dd4a7edf787a
                ©Kamal Kishore, Vidushi Jaswal, Madhur Verma, Vipin Koushal. Originally published in JMIR Public Health and Surveillance (https://publichealth.jmir.org), 30.08.2021.

                This is an open-access article distributed under the terms of the Creative Commons Attribution License ( https://creativecommons.org/licenses/by/4.0/), which permits unrestricted use, distribution, and reproduction in any medium, provided the original work, first published in JMIR Public Health and Surveillance, is properly cited. The complete bibliographic information, a link to the original publication on https://publichealth.jmir.org, as well as this copyright and license information must be included.

                History
                : 26 April 2021
                : 21 May 2021
                : 10 June 2021
                : 17 June 2021
                Categories
                Original Paper
                Original Paper

                covid-19,lockdown,nonpharmaceutical interventions,social distancing,digital surveillance,google community mobility reports,community mobility

                Comments

                Comment on this article