58
views
0
recommends
+1 Recommend
2 collections
    0
    shares
      • Record: found
      • Abstract: found
      • Article: found
      Is Open Access

      Mental Health–Related Emergency Department Visits Among Children Aged <18 Years During the COVID-19 Pandemic — United States, January 1–October 17, 2020

      research-article

      Read this article at

      Bookmark
          There is no author summary for this article yet. Authors can add summaries to their articles on ScienceOpen to make them more accessible to a non-specialist audience.

          Abstract

          Published reports suggest that the coronavirus disease 2019 (COVID-19) pandemic has had a negative effect on children’s mental health ( 1 , 2 ). Emergency departments (EDs) are often the first point of care for children experiencing mental health emergencies, particularly when other services are inaccessible or unavailable ( 3 ). During March 29–April 25, 2020, when widespread shelter-in-place orders were in effect, ED visits for persons of all ages declined 42% compared with the same period in 2019; during this time, ED visits for injury and non-COVID-19–related diagnoses decreased, while ED visits for psychosocial factors increased ( 4 ). To assess changes in mental health–related ED visits among U.S. children aged <18 years, data from CDC’s National Syndromic Surveillance Program (NSSP) from January 1 through October 17, 2020, were compared with those collected during the same period in 2019. During weeks 1–11 (January 1–March 15, 2020), the average reported number of children’s mental health–related ED visits overall was higher in 2020 than in 2019, whereas the proportion of children’s mental health–related visits was similar. Beginning in week 12 (March 16) the number of mental health–related ED visits among children decreased 43% concurrent with the widespread implementation of COVID-19 mitigation measures; simultaneously, the proportion of mental health–related ED visits increased sharply beginning in mid-March 2020 (week 12) and continued into October (week 42) with increases of 24% among children aged 5–11 years and 31% among adolescents aged 12–17 years, compared with the same period in 2019. The increased proportion of children’s mental health–related ED visits during March–October 2020 might be artefactually inflated as a consequence of the substantial decrease in overall ED visits during the same period and variation in the number of EDs reporting to NSSP. However, these findings provide initial insight into children’s mental health in the context of the COVID-19 pandemic and highlight the importance of continued monitoring of children’s mental health throughout the pandemic, ensuring access to care during public health crises, and improving healthy coping strategies and resiliency among children and families. CDC analyzed NSSP ED visit data, which include a subset of hospitals in 47 states representing approximately 73% of U.S. ED visits.* Mental health–related ED visits among children aged <18 years was a composite variable derived from the mental health syndrome query of the NSSP data for conditions likely to result in ED visits during and after disaster events (e.g., stress, anxiety, acute posttraumatic stress disorder, and panic). † Weekly numbers of mental health–related ED visits and proportions of mental health–related ED visits (per 100,000 pediatric ED visits § ) were computed overall, stratified by age group (0–4, 5–11, and 12–17 years) and sex, and compared descriptively with the corresponding weekly numbers and proportions for 2019. Numbers and proportions of visits were compared during calendar weeks 1–11 (January 1–March 14, 2020) and weeks 12–42 (March 15–October 17, 2020) (before and after a distinct decrease in overall ED visits reported beginning in week 12 in 2020) ¶ ( 4 ). Analyses are descriptive and statistical comparisons were not performed. The number of children’s mental health–related ED visits decreased sharply from mid-March 2020 (week 12, March 15–21) through early April (week 15, April 5–11) and then increased steadily through October 2020. (Figure 1). During the same time, the overall proportion of reported children’s ED visits for mental health–related concerns increased and remained higher through the end of the reporting period in 2020 than that in 2019 (Figure 1). The proportion of mental health–related ED visits among children increased 66%, from 1,094 per 100,000 during April 14–21, 2019 to 1,820 per 100,000 during April 12–18, 2020 (Supplementary Figure 1, https://stacks.cdc.gov/view/cdc/96609). Although the average reported number of children’s mental health–related ED visits overall was 25% higher during weeks 1–11 in 2020 (342,740) than during the corresponding period in 2019 (274,736), the proportion of children’s mental health–related visits during the same time was similar (1,162 per 100,000 in 2020 versus 1,044 per 100,000 in 2019). (Table). During weeks 12–42, 2020 (mid-March–October) however, average weekly reported numbers of total ED visits by children were 43% lower (149,055), compared with those during 2019 (262,714), whereas the average proportion of children’s mental health–related ED visits was approximately 44% higher in 2020 (1,673 per 100,000) than that in 2019 (1,161 per 100,000).
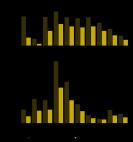
 FIGURE 1 Weekly number of emergency department (ED) mental health–related visits (A) and proportion of (B) children’s mental health–related ED visits per total ED visits* among children aged <18 years — National Syndromic Surveillance Program, United States, January–October 2019 and 2020 * Proportion of mental health–related ED visits = number of ED visits for children’s mental health/total number of pediatric ED visits x 100,000. The figure is a line chart showing the weekly number of emergency department (ED) mental health–related visits (A) and proportion of (B) children’s mental health–related ED visits per total ED visits among children aged <18 years, using data from the National Syndromic Surveillance Program, in the United States, during January–October 2019 and 2020. TABLE Average number and proportions* of emergency department (ED) visits and mental health–related ED visits † among children aged <18 years — National Syndromic Surveillance Program (NSSP), United States, 2019–2020 Surveillance period/indicators 2019 2020 Age group, yrs Age group, yrs All <18 0–4 5–11 12–17 All <18 0–4 5–11 12–17 Weeks 1–42 § Average weekly total ED visits 265,863 110,002 81,133 74,728 199,782 78,742 59,660 61,380 Average weekly mental health–related ED visits 3,025 80 625 2,320 2,872 54 522 2,296 Mental health–related ED visits per 100,000 visits 1,130 73 762 3,084 1,539 75 919 3,863 Weeks 1–11 ¶ Average weekly total ED visits 274,736 118,926 83,924 71,886 342,740 143,789 107,049 91,902 Average weekly mental health–related ED visits 2,876 82 594 2,200 3,974 80 821 3,073 Mental health–related ED visits per 100,000 visits 1,044 69 707 30,45 1,162 56 769 3,333 Weeks 12–42** Average weekly total ED visits 262,714 106,835 80,143 75,736 149,055 55,661 42,844 50,550 Average weekly mental health–related ED visits 3,078 79 635 2,363 2,481 45 416 2,020 Mental health–related ED visits per 100,000 visits 1,161 75 782 3,098 1,673 81 972 4,051 * Average proportion of ED visits for children’s mental health = (average number of ED visits for children’s mental health/average total number of ED visits for the same age or sex population [e.g., children aged 18 years]) x 100,000. All numbers have been rounded to the nearest whole number. † Mental health–related ED visits were defined using NSSP’s Syndrome Definition (SD) Subcommittee community-developed syndrome definition for mental health conditions likely to increase in ED frequency during and after natural or human-caused disaster events. This syndrome definition attempts to leverage only mental health conditions and presentations that showed increases in visit frequency after select disasters in the United States. There are no disaster-related terms inherent to this query. The query has been added to NSSP BioSense Platform Electronic Surveillance System for the Early Notification of Community-based Epidemics as a Chief Complaint and Discharge Diagnosis category. https://knowledgerepository.syndromicsurveillance.org/disaster-related-mental-health-v1-syndrome-definition-subcommittee. § Weeks 1–42 in 2019 correspond to December 30, 2018–October 19, 2019; weeks 1–42 in 2020 correspond to December 29, 2019–October 17, 2020. ¶ Weeks 1–11 in 2019 correspond to December 30, 2018–March 16, 2019; weeks 1–11 in 2020 correspond to December 29, 2019–March 14, 2020. ** Weeks 12–42 in 2019 correspond to March 17–October 19, 2019; weeks 12–42 in 2020 correspond to March 15–October 17, 2020. Adolescents aged 12–17 years accounted for the largest proportion of children’s mental health–related ED visits during 2019 and 2020 (Figure 2). During weeks 12–42, 2020, the proportion of mental health–related visits for children aged 5–11 years and adolescents aged 12–17 years increased approximately 24% and 31%, respectively compared with those in 2019; the proportion of mental health–related visits for children aged 0–4 years remained similar in 2020. (Table.) The highest weekly proportion of mental health–related ED visits occurred during October for children aged 5–11 years (week 42; 1,177 per 100,000) and during April (week 16) for adolescents aged 12–17 years (4,758 per 100,000) (Figure 2). FIGURE 2 Weekly proportion of mental health–related emergency department (ED) visits* per total ED visits among children aged <18 years, by age group — National Syndromic Surveillance Program, United States, January–October 2019 and 2020 * Proportion of mental health–related ED visits = number of ED visits for children’s mental health/total number of pediatric ED visits x 100,000. The figure is a line chart showing the weekly proportion of mental health–related emergency department (ED) visits per total ED visits among children aged <18 years, by age group, using data from the National Syndromic Surveillance Program, in the United States, during January–October 2019 and 2020. During 2019 and 2020, the proportion of mental health–related ED visits was higher among females aged <18 years than it was among males (Supplementary Figure 2, https://stacks.cdc.gov/view/cdc/96610). Similar patterns of increasing proportions of mental health–related ED visits were observed in 2020 for males and females, with increases beginning mid-March and continuing through October. Discussion Substantial declines in the overall reported numbers of children’s mental health–related ED visits occurred in 2020 during mid-March to early May, coincident with the widespread implementation of community mitigation measures** enacted to prevent COVID-19 transmission (e.g., school closures and restrictions to nonemergent care) and decreases in overall ED visits for the same period ( 4 ). A previous report found the mean weekly number of ED visits for children aged <14 years declined approximately 70% during March 29–April 25, 2020, relative to the corresponding period in 2019 ( 4 ). Further, the mean number of weekly ED visits for persons of all ages decreased significantly for asthma (–10%), otitis media (–65%), and sprain- and strain-related injuries (–39%), and mean weekly ED visits for psychosocial factors increased 69% ( 4 ). This report demonstrates that, whereas the overall number of children’s mental health–related ED visits decreased, the proportion of all ED visits for children’s mental health–related concerns increased, reaching levels substantially higher beginning in late-March to October 2020 than those during the same period during 2019. Describing both the number and the proportion of mental health–related ED visits provides crucial context for these findings and suggests that children’s mental health warranted sufficient concern to visit EDs during a time when nonemergent ED visits were discouraged. Many children receive mental health services through clinical and community agencies, including schools ( 5 ). The increase in the proportion of ED visits for children’s mental health concerns might reflect increased pandemic-related stress and unintended consequences of mitigation measures, which reduced or modified access to children’s mental health services ( 2 ), and could result in increased reliance on ED services for both routine and crisis treatment ( 3 ). However, the magnitude of the increase should be interpreted carefully because it might also reflect the large decrease in the number and proportion of other types of ED visits (e.g., asthma, otitis media, and musculoskeletal injuries) ( 4 ) and variation in the number of EDs reporting to NSSP. Adolescents aged 12–17 years accounted for the highest proportion of mental health–related ED visits in both 2019 and 2020, followed by children aged 5–11 years. Many mental disorders commence in childhood, and mental health concerns in these age groups might be exacerbated by stress related to the pandemic and abrupt disruptions to daily life associated with mitigation efforts, including anxiety about illness, social isolation, and interrupted connectedness to school ( 5 ). The majority of EDs lack adequate capacity to treat pediatric mental health concerns ( 6 ), potentially increasing demand on systems already stressed by the COVID-19 pandemic. These findings demonstrate continued need for mental health care for children during the pandemic and highlight the importance of expanding mental health services, such as telemental health and technology-based solutions (e.g., mobile mental health applications) ( 5 , 7 ). The findings in this report are subject to at least three limitations. First, the proportions presented should be interpreted with caution because of variations affecting the denominators used to calculate proportions. Children’s mental health–related ED visits constitute a small percentage of all pediatric ED visits (1.1% in 2019 and 1.4% in 2020), increasing susceptibility of rates to decreases in ED visits during the pandemic. In addition, NSSP ED participation can vary over time; however, analyzing number of visits and proportion of total ED visits provides context for observed variation. Second, NSSP data are not nationally representative; these findings might not be generalizable beyond those EDs participating in NSSP. Further, usable information on race and ethnicity was not available in the NSSP data. Finally, these data are subject to under- and overestimation. Variation in reporting and coding practices can influence the number and proportion of mental health–related visits observed. ED visits represent unique events, not individual persons, and as such, might reflect multiple visits for one person. The definition of mental health focuses on symptoms and conditions (e.g., stress, anxiety) that might increase after a disaster in the United States and might not reflect all mental health–related ED visits. Still, these data likely underestimate the actual number of mental health–related health care visits because many mental health visits occur outside of EDs. Children’s mental health during public health emergencies can have both short- and long-term consequences to their overall health and well-being ( 8 ). This report provides timely surveillance data concerning children’s mental health in the context of the COVID-19 pandemic. Ongoing collection of a broad range of children’s mental health data outside the ED is needed to monitor the impact of COVID-19 and the effects of public health emergencies on children’s mental health. Ensuring availability of and access to developmentally appropriate mental health services for children outside the in-person ED setting will be important as communities adjust mitigation strategies ( 3 ). Implementation of technology-based, remote mental health services and prevention activities to enhance healthy coping and resilience in children might effectively support their well-being throughout response and recovery periods ( 5 , 7 ). CDC supports efforts to promote the emotional well-being of children and families and provides developmentally appropriate resources for families to reduce stressors that might contribute to children’s mental health–related ED visits †† ( 9 ). Summary What is already known about this topic? Emergency departments (EDs) are often the first point of care for children’s mental health emergencies. U.S. ED visits for persons of all ages declined during the early COVID-19 pandemic (March–April 2020). What is added by this report? Beginning in April 2020, the proportion of children’s mental health–related ED visits among all pediatric ED visits increased and remained elevated through October. Compared with 2019, the proportion of mental health–related visits for children aged 5–11 and 12–17 years increased approximately 24%. and 31%, respectively. What are the implications for public health practice? Monitoring indicators of children's mental health, promoting coping and resilience, and expanding access to services to support children's mental health are critical during the COVID-19 pandemic.

          Related collections

          Most cited references6

          • Record: found
          • Abstract: found
          • Article: found
          Is Open Access

          Impact of the COVID-19 Pandemic on Emergency Department Visits — United States, January 1, 2019–May 30, 2020

          On March 13, 2020, the United States declared a national emergency to combat coronavirus disease 2019 (COVID-19). As the number of persons hospitalized with COVID-19 increased, early reports from Austria ( 1 ), Hong Kong ( 2 ), Italy ( 3 ), and California ( 4 ) suggested sharp drops in the numbers of persons seeking emergency medical care for other reasons. To quantify the effect of COVID-19 on U.S. emergency department (ED) visits, CDC compared the volume of ED visits during four weeks early in the pandemic March 29–April 25, 2020 (weeks 14 to 17; the early pandemic period) to that during March 31–April 27, 2019 (the comparison period). During the early pandemic period, the total number of U.S. ED visits was 42% lower than during the same period a year earlier, with the largest declines in visits in persons aged ≤14 years, females, and the Northeast region. Health messages that reinforce the importance of immediately seeking care for symptoms of serious conditions, such as myocardial infarction, are needed. To minimize SARS-CoV-2, the virus that causes COVID-19, transmission risk and address public concerns about visiting the ED during the pandemic, CDC recommends continued use of virtual visits and triage help lines and adherence to CDC infection control guidance. To assess trends in ED visits during the pandemic, CDC analyzed data from the National Syndromic Surveillance Program (NSSP), a collaborative network developed and maintained by CDC, state and local health departments, and academic and private sector health partners to collect electronic health data in real time. The national data in NSSP includes ED visits from a subset of hospitals in 47 states (all but Hawaii, South Dakota, and Wyoming), capturing approximately 73% of ED visits in the United States able to be analyzed at the national level. During the most recent week, 3,552 EDs reported data. Total ED visit volume, as well as patient age, sex, region, and reason for visit were analyzed. Weekly number of ED visits were examined during January 1, 2019–May 30, 2020. In addition, ED visits during two 4-week periods were compared using mean differences and ratios. The change in mean visits per week during the early pandemic period and the comparison period was calculated as the mean difference in total visits in a diagnostic category between the two periods, divided by 4 weeks ([visits in diagnostic category {early pandemic period} – visits in diagnostic category {comparison period}]/4). The visit prevalence ratio (PR) was calculated for each diagnostic category as the proportion of ED visits during the early pandemic period divided by the proportion of visits during the comparison period ([visits in category {early pandemic period}/all visits {early pandemic period}]/[visits in category {comparison period}/all visits {comparison period}]). All analyses were conducted using R software (version 3.6.0; R Foundation). Reason for visit was analyzed using a subset of records that had at least one specific, billable International Classification of Diseases, Tenth Revision, Clinical Modification (ICD-10-CM) code. In addition to Hawaii, South Dakota, and Wyoming, four states (Florida, Louisiana, New York outside New York City, and Oklahoma), two California counties reporting to the NSSP (Santa Cruz and Solano), and the District of Columbia were also excluded from the diagnostic code analysis because they did not report diagnostic codes during both periods or had differences in completeness of codes between 2019 and 2020. Among eligible visits for the diagnostic code analysis, 20.3% without a valid ICD-10-CM code were excluded. ED visits were categorized using the Clinical Classifications Software Refined tool (version 2020.2; Healthcare Cost and Utilization Project), which combines ICD-10-CM codes into clinically meaningful groups ( 5 ). A visit with multiple ICD-10-CM codes could be included in multiple categories; for example, a visit by a patient with diabetes and hypertension would be included in the category for diabetes and the category for hypertension. Because COVID-19 is not yet classified in this tool, a custom category, defined as any visit with the ICD-10-CM code for confirmed COVID-19 diagnosis (U07.1), was created ( 6 ). The analysis was limited to the top 200 diagnostic categories during each period. The lowest number of visits reported to NSSP occurred during April 12–18, 2020 (week 16). Although visits have increased since the nadir, the most recent complete week (May 24–30, week 22) remained 26% below the corresponding week in 2019 (Figure 1). The number of ED visits decreased 42%, from a mean of 2,099,734 per week during March 31–April 27, 2019, to a mean of 1,220,211 per week during the early pandemic period of March 29–April 25, 2020. Visits declined for every age group (Figure 2), with the largest proportional declines in visits by children aged ≤10 years (72%) and 11–14 years (71%). Declines in ED visits varied by U.S. Department of Health and Human Services region,* with the largest declines in the Northeast (Region 1, 49%) and in the region that includes New Jersey and New York (Region 2, 48%) (Figure 2). Visits declined 37% among males and 45% among females across all NSSP EDs between the comparison and early pandemic periods. FIGURE 1 Weekly number of emergency department (ED) visits — National Syndromic Surveillance Program, United States,* January 1, 2019– May 30, 2020† * Hawaii, South Dakota, and Wyoming are not included. † Vertical lines indicate the beginning and end of the 4-week coronavirus disease 2019 (COVID-19) early pandemic period (March 29–April 25, 2020) and the comparison period (March 31–April 27, 2019). The figure is a line graph showing the weekly number of emergency department visits, using data from the National Syndromic Surveillance Program, in the United States, during January 1, 2019–May 30, 2020. FIGURE 2 Emergency department (ED) visits, by age group (A) and U.S. Department of Health and Human Services (HHS) region* (B) — National Syndromic Surveillance Program, United States,† March 31–April 27, 2019 (comparison period) and March 29–April 25, 2020 (early pandemic period) * Region 1: Connecticut, Maine, Massachusetts, New Hampshire, Rhode Island, and Vermont; Region 2: New Jersey and New York; Region 3: Delaware, District of Columbia, Maryland, Pennsylvania, Virginia, and West Virginia; Region 4: Alabama, Florida, Georgia, Kentucky, Mississippi, North Carolina, South Carolina, and Tennessee; Region 5: Illinois, Indiana, Michigan, Minnesota, Ohio, and Wisconsin; Region 6: Arkansas, Louisiana, New Mexico, Oklahoma, and Texas; Region 7: Iowa, Kansas, Missouri, and Nebraska; Region 8: Colorado, Montana, North Dakota, and Utah; Region 9: Arizona, California, and Nevada; Region 10: Alaska, Idaho, Oregon, and Washington. † Hawaii, South Dakota, and Wyoming are not included. The figure is a bar chart showing the emergency department visits, by age group and U.S. Department of Health and Human Services region, using data from the National Syndromic Surveillance Program, in the United States, during March 31–April 27, 2019 (comparison period) and March 29–April 25, 2020 (pandemic period). Among all ages, an increase of >100 mean visits per week from the comparison period to the early pandemic period occurred in eight of the top 200 diagnostic categories (Table). These included 1) exposure, encounters, screening, or contact with infectious disease (mean increase 18,834 visits per week); 2) COVID-19 (17,774); 3) other general signs and symptoms (4,532); 4) pneumonia not caused by tuberculosis (3,911); 5) other specified and unspecified lower respiratory disease (1,506); 6) respiratory failure, insufficiency, or arrest (776); 7) cardiac arrest and ventricular fibrillation (472); and 8) socioeconomic or psychosocial factors (354). The largest declines were in visits for abdominal pain and other digestive or abdomen signs and symptoms (–66,456), musculoskeletal pain excluding low back pain (–52,150), essential hypertension (–45,184), nausea and vomiting (–38,536), other specified upper respiratory infections (–36,189), sprains and strains (–33,709), and superficial injuries (–30,918). Visits for nonspecific chest pain were also among the top 20 diagnostic categories for which visits decreased (–24,258). Although not in the top 20 declining diagnoses, visits for acute myocardial infarction also declined (–1,156). TABLE Differences in mean weekly numbers of emergency department (ED) visits* for diagnostic categories with the largest increases or decreases† and prevalence ratios§ comparing the proportion of ED visits in each diagnostic category, for categories with the highest and lowest ratios — National Syndromic Surveillance Program, United States,¶ March 31–April 27, 2019 (comparison period) and March 29–April 25, 2020 (early pandemic period) Diagnostic category Change in mean no. of weekly ED visits* Prevalence ratio (95% CI)§ All categories with higher visit counts during the early pandemic period Exposure, encounters, screening, or contact with infectious disease** 18,834 3.79 (3.76–3.83) COVID-19 17,774 — Other general signs and symptoms** 4,532 1.87 (1.86–1.89) Pneumonia (except that caused by tuberculosis)** 3,911 1.91 (1.90–1.93) Other specified and unspecified lower respiratory disease** 1,506 1.99 (1.96–2.02) Respiratory failure, insufficiency, arrest** 776 1.76 (1.74–1.78) Cardiac arrest and ventricular fibrillation** 472 1.98 (1.93–2.03) Socioeconomic or psychosocial factors** 354 1.78 (1.75–1.81) Other top 10 highest prevalence ratios Mental and substance use disorders, in remission** 6 1.69 (1.64–1.75) Other specified encounters and counseling** 22 1.69 (1.67–1.72) Stimulant-related disorders** −189 1.65 (1.62–1.67) Top 20 categories with lower visit counts during the early pandemic period Abdominal pain and other digestive or abdomen signs and symptoms −66,456 0.93 (0.93–0.93) Musculoskeletal pain, not low back pain −52,150 0.81 (0.81–0.82) Essential hypertension −45,184 1.11 (1.10–1.11) Nausea and vomiting −38,536 0.85 (0.84–0.85) Other specified upper respiratory infections −36,189 0.82 (0.81–0.82) Sprains and strains, initial encounter †† −33,709 0.61 (0.61–0.62) Superficial injury; contusion, initial encounter −30,918 0.85 (0.84–0.85) Personal or family history of disease −28,734 1.21 (1.20–1.22) Headache, including migraine −27,458 0.85 (0.84–0.85) Other unspecified injury −25,974 0.84 (0.83–0.84) Nonspecific chest pain −24,258 1.20 (1.20–1.21) Tobacco-related disorders −23,657 1.19 (1.18–1.19) Urinary tract infections −23,346 1.02 (1.02–1.03) Asthma −20,660 0.91 (0.90–0.91) Disorders of lipid metabolism −20,145 1.12 (1.11–1.13) Spondylopathies/Spondyloarthropathy (including infective) −19,441 0.78 (0.77–0.79) Otitis media †† −17,852 0.35 (0.34–0.36) Diabetes mellitus without complication −15,893 1.10 (1.10–1.11) Skin and subcutaneous tissue infections −15,598 1.01 (1.00–1.02) Chronic obstructive pulmonary disease and bronchiectasis −15,520 1.05 (1.04–1.06) Other top 10 lowest prevalence ratios Influenza †† −12,094 0.16 (0.15–0.16) No immunization or underimmunization †† −1,895 0.28 (0.27–0.30) Neoplasm-related encounters †† −1,926 0.40 (0.39–0.42) Intestinal infection †† −5,310 0.52 (0.51–0.54) Cornea and external disease †† −9,096 0.54 (0.53–0.55) Sinusitis †† −7,283 0.55 (0.54–0.56) Acute bronchitis †† −15,470 0.59 (0.58–0.60) Noninfectious gastroenteritis †† −11,572 0.63 (0.62–0.64) Abbreviations: CI = confidence interval; COVID-19 = coronavirus disease 2019. * The change in visits per week during the early pandemic and comparison periods was calculated as the difference in total visits between the two periods, divided by 4 weeks ([visits in diagnostic category, {early pandemic period} – visits in diagnostic category, {comparison period}] / 4). † Analysis is limited to the 200 most common diagnostic categories. All eight diagnostic categories with an increase of >100 in the mean number of visits nationwide in the early pandemic period are shown. The top 20 categories with decreasing visit counts are shown. § Ratio calculated as the proportion of all ED visits in each diagnostic category during the early pandemic period, divided by the proportion of all ED visits in that category during the comparison period ([visits in category {early pandemic period}/all visits {early pandemic period})/(visits in category {comparison period}/all visits {comparison period}]). Ratios >1 indicate a higher proportion of visits in that category during the early pandemic period than the comparison period; ratios <1 indicate a lower proportion during the early pandemic than during the comparison period. Analysis is limited to the 200 most common diagnostic categories. The 10 categories with the highest and lowest ratios are shown. ¶ Florida, Hawaii, Louisiana, New York outside of New York City, Oklahoma, South Dakota, Wyoming, Santa Cruz and Solano counties in California, and the District of Columbia are not included. ** Top 10 highest prevalence ratios; higher proportion of visits in the early pandemic period than the comparison period. †† Top 10 lowest prevalence ratios; lower proportion of visits in the early pandemic period than the comparison period. During the early pandemic period, the proportion of ED visits for exposure, encounters, screening, or contact with infectious disease compared with total visits was nearly four times as large as during the comparison period (Table) (prevalence ratio [PR] = 3.79, 95% confidence interval [CI] = 3.76–3.83). The other diagnostic categories with the highest proportions of visits during the early pandemic compared with the comparison period were other specified and unspecified lower respiratory disease, which did not include influenza, pneumonia, asthma, or bronchitis (PR = 1.99; 95% CI = 1.96–2.02), cardiac arrest and ventricular fibrillation (PR = 1.98; 95% CI = 1.93–2.03), and pneumonia not caused by tuberculosis (PR = 1.91; 95% CI = 1.90–1.93). Diagnostic categories that were recorded less commonly during the early pandemic period included influenza (PR = 0.16; 95% CI = 0.15–0.16), no immunization or underimmunization (PR = 0.28; 95% CI = 0.27–0.30), otitis media (PR = 0.35; 95% CI = 0.34–0.36), and neoplasm-related encounters (PR = 0.40; 95% CI = 0.39–0.42). In the 2019 comparison period, 12% of all ED visits were in children aged ≤10 years old, compared with 6% during the early pandemic period. Among children aged ≤10 years, the largest declines were in visits for influenza (97% decrease), otitis media (85%), other specified upper respiratory conditions (84%), nausea and vomiting (84%), asthma (84%), viral infection (79%), respiratory signs and symptoms (78%), abdominal pain and other digestive or abdomen symptoms (78%), and fever (72%). Mean weekly visits with confirmed COVID-19 diagnoses and screening for infectious disease during the early pandemic period were lower among children than among adults. Among all ages, the diagnostic categories with the largest changes (abdominal pain and other digestive or abdomen signs and symptoms, musculoskeletal pain, and essential hypertension) were the same in males and females, but declines in those categories were larger in females than males. Females also had large declines in visits for urinary tract infections (–19,833 mean weekly visits). Discussion During an early 4-week interval in the COVID-19 pandemic, ED visits were substantially lower than during the same 4-week period during the previous year; these decreases were especially pronounced for children and females and in the Northeast. In addition to diagnoses associated with lower respiratory disease, pneumonia, and difficulty breathing, the number and ratio of visits (early pandemic period versus comparison period) for cardiac arrest and ventricular fibrillation increased. The number of visits for conditions including nonspecific chest pain and acute myocardial infarction decreased, suggesting that some persons could be delaying care for conditions that might result in additional mortality if left untreated. Some declines were in categories including otitis media, superficial injuries, and sprains and strains that can often be managed through primary or urgent care. Future analyses will help clarify the proportion of the decline in ED visits that were not preventable or avoidable such as those for life-threatening conditions, those that were manageable through primary care, and those that represented actual reductions in injuries or illness attributable to changing activity patterns during the pandemic (such as lower risks for occupational and motor vehicle injuries or other infectious diseases). The striking decline in ED visits nationwide, with the highest declines in regions where the pandemic was most severe in April 2020, suggests that the pandemic has altered the use of the ED by the public. Persons who use the ED as a safety net because they lack access to primary care and telemedicine might be disproportionately affected if they avoid seeking care because of concerns about the infection risk in the ED. Syndromic surveillance has important strengths, including automated electronic reporting and the ability to track outbreaks in real time ( 7 ). Among all visits, 74% are reported within 24 hours, with 75% of discharge diagnoses typically added to the record within 1 week. The findings in this report are subject to at least four limitations. First, hospitals reporting to NSSP change over time as facilities are added, and more rarely, as they close ( 8 ). An average of 3,173 hospitals reported to NSSP nationally in April 2019, representing an estimated 66% of U.S. ED visits, and an average of 3,467 reported in April 2020, representing 73% of ED visits. Second, diagnostic categories rely on the use of specific codes, which were missing in 20% of visits and might be used inconsistently across hospitals and providers, which could result in misclassification. The COVID-19 diagnosis code was introduced recently (April 1, 2020) and timing of uptake might have differed across hospitals ( 6 ). Third, NSSP coverage is not uniform across or within all states; in some states nearly all hospitals report, whereas in others, a lower proportion statewide or only those in certain counties report. Finally, because this analysis is limited to ED visit data, the proportion of persons who did not visit EDs but received treatment elsewhere is not captured. Health care systems should continue to address public concern about exposure to SARS-CoV-2 in the ED through adherence to CDC infection control recommendations, such as immediately screening every person for fever and symptoms of COVID-19, and maintaining separate, well-ventilated triage areas for patients with and without signs and symptoms of COVID-19 ( 9 ). Wider access is needed to health messages that reinforce the importance of immediately seeking care for serious conditions for which ED visits cannot be avoided, such as symptoms of myocardial infarction. Expanded access to triage telephone lines that help persons rapidly decide whether they need to go to an ED for symptoms of possible COVID-19 infection and other urgent conditions is also needed. For conditions that do not require immediate care or in-person treatment, health care systems should continue to expand the use of virtual visits during the pandemic ( 10 ). Summary What is already known about this topic? The National Syndromic Surveillance Program (NSSP) collects electronic health data in real time. What is added by this report? NSSP found that emergency department (ED) visits declined 42% during the early COVID-19 pandemic, from a mean of 2.1 million per week (March 31–April 27, 2019) to 1.2 million (March 29–April 25, 2020), with the steepest decreases in persons aged ≤14 years, females, and the Northeast. The proportion of infectious disease–related visits was four times higher during the early pandemic period. What are the implications for public health practice? To minimize SARS-CoV-2 transmission risk and address public concerns about visiting the ED during the pandemic, CDC recommends continued use of virtual visits and triage help lines and adherence to CDC infection control guidance.
            Bookmark
            • Record: found
            • Abstract: not found
            • Article: not found

            Coronavirus Disease 2019 (COVID-19) and Mental Health for Children and Adolescents

              Bookmark
              • Record: found
              • Abstract: found
              • Article: not found

              Well-being of Parents and Children During the COVID-19 Pandemic: A National Survey

              As the coronavirus disease pandemic spread across the United States and protective measures to mitigate its impact were enacted, parents and children experienced widespread disruptions in daily life. Our objective with this national survey was to determine how the pandemic and mitigation efforts affected the physical and emotional well-being of parents and children in the United States through early June 2020.
                Bookmark

                Author and article information

                Journal
                MMWR Morb Mortal Wkly Rep
                MMWR Morb Mortal Wkly Rep
                WR
                Morbidity and Mortality Weekly Report
                Centers for Disease Control and Prevention
                0149-2195
                1545-861X
                13 November 2020
                13 November 2020
                : 69
                : 45
                : 1675-1680
                Affiliations
                Division of Human Development and Disability, National Center on Birth Defects and Developmental Disabilities, CDC; Innovation, Technology, and Analytics Task Force, CDC COVID-19 Response Team; Division of Injury Prevention, National Center for Injury Prevention and Control, CDC; Community Interventions and Critical Populations Task Force, CDC COVID-19 Response Team; Division of Overdose Prevention, National Center for Injury Prevention and Control, CDC.
                Author notes
                Corresponding author: Rebecca T. Leeb, RLeeb@ 123456CDC.gov .
                Article
                mm6945a3
                10.15585/mmwr.mm6945a3
                7660659
                33180751
                eeb837a5-a511-49e6-9d65-aa26fe9c5d6e

                All material in the MMWR Series is in the public domain and may be used and reprinted without permission; citation as to source, however, is appreciated.

                History
                Categories
                Full Report

                Comments

                Comment on this article