51
views
0
recommends
+1 Recommend
1 collections
    0
    shares
      • Record: found
      • Abstract: found
      • Article: found
      Is Open Access

      Knowledge and Practices Regarding Safe Household Cleaning and Disinfection for COVID-19 Prevention — United States, May 2020

      research-article

      Read this article at

      Bookmark
          There is no author summary for this article yet. Authors can add summaries to their articles on ScienceOpen to make them more accessible to a non-specialist audience.

          Abstract

          On June 5, 2020, this report was posted online as an MMWR Early Release. A recent report described a sharp increase in calls to poison centers related to exposures to cleaners and disinfectants since the onset of the coronavirus disease 2019 (COVID-19) pandemic ( 1 ). However, data describing cleaning and disinfection practices within household settings in the United States are limited, particularly concerning those practices intended to prevent transmission of SARS-CoV-2, the virus that causes COVID-19. To provide contextual and behavioral insight into the reported increase in poison center calls and to inform timely and relevant prevention strategies, an opt-in Internet panel survey of 502 U.S. adults was conducted in May 2020 to characterize knowledge and practices regarding household cleaning and disinfection during the COVID-19 pandemic. Knowledge gaps were identified in several areas, including safe preparation of cleaning and disinfectant solutions, use of recommended personal protective equipment when using cleaners and disinfectants, and safe storage of hand sanitizers, cleaners, and disinfectants. Thirty-nine percent of respondents reported engaging in nonrecommended high-risk practices with the intent of preventing SARS-CoV-2 transmission, such as washing food products with bleach, applying household cleaning or disinfectant products to bare skin, and intentionally inhaling or ingesting these products. Respondents who engaged in high-risk practices more frequently reported an adverse health effect that they believed was a result of using cleaners or disinfectants than did those who did not report engaging in these practices. Public messaging should continue to emphasize evidence-based, safe practices such as hand hygiene and recommended cleaning and disinfection of high-touch surfaces to prevent transmission of SARS-CoV-2 in household settings ( 2 ). Messaging should also emphasize avoidance of high-risk practices such as unsafe preparation of cleaning and disinfectant solutions, use of bleach on food products, application of household cleaning and disinfectant products to skin, and inhalation or ingestion of cleaners and disinfectants. Survey questions were administered by Porter Novelli Public Services and ENGINE Insights on May 4, 2020, through PN View: 360,* a rapid turnaround survey that can be used to provide insights into knowledge and practices of targeted audiences. This opt-in Internet panel survey was administered to 502 U.S. adults aged ≥18 years using the Lucid platform ( 3 ); panel members who had not taken a survey in the previous 20 waves of survey administration were eligible to participate. Quota sampling and statistical weighting were employed to make the panel representative of the U.S. population by gender, age, region, race/ethnicity, and education. Respondents were informed that their answers were being used for market research and could refuse to answer any question at any time. No personally identifying information was included in the data file provided to CDC. † Survey questions asked about general knowledge, attitudes, and practices related to use of household cleaners and disinfectants § and about specific information regarding cleaning and disinfection strategies for prevention of SARS-CoV-2 transmission. Weighted response frequencies were calculated using SAS statistical software (version 9.4; SAS Institute). Because respondents were recruited from an opt-in panel rather than by probability sampling, no inferential statistical tests were performed. ¶ Differences were noted when a difference of ≥5 percentage points was found between any estimates being compared. The median age of respondents was 46 years (range = 18–86 years), and 52% of respondents were female. Overall, 63% of respondents were non-Hispanic white, 16% were Hispanic (any race), 12% were non-Hispanic black, and 8% were multiracial or of other race/ethnicity. Respondents represented all U.S. Census regions,** with 38% from the South, 24% from the West, 21% from the Midwest, and 18% from the Northeast. Participants had limited knowledge of safe preparation of cleaning and disinfectant solutions (Figure 1). Overall, 23% responded that only room temperature water should be used for preparation of dilute bleach solutions, 35% that bleach should not be mixed with vinegar, and 58% that bleach should not be mixed with ammonia. In comparison, a higher percentage of respondents had knowledge about use of recommended personal protective equipment: 64% responded that eye protection was recommended for use of some cleaners and disinfectants, and 71% responded that gloves were recommended for use. Similarly, 68% responded that handwashing was recommended after using cleaners and disinfectants and 73% that adequate ventilation was recommended when using these products. Regarding safe storage of cleaners, disinfectants, and hand sanitizers, 79% of respondents said that cleaners and disinfectants should be kept out of the reach of children, and 54% that hand sanitizers should be kept out of the reach of children. FIGURE 1 Knowledge about safe use of cleaners and disinfectants,* , † based on responses to an opt-in Internet panel survey § (N = 502 respondents) — United States, May 2020 * In response to the question ”Which of the following have you heard is true about using household cleaning products (such as bleach or Lysol)?”; response options reflected CDC recommendations for safe cleaning and disinfection. https://www.cdc.gov/coronavirus/2019-ncov/prevent-getting-sick/disinfecting-your-home.html. † In survey questions, the term “cleaning” referred to using a cleaner or disinfectant on surfaces or objects. Questions regarding storage of hand sanitizers were included with questions regarding storage of cleaners and disinfectants. § Survey administered by Porter Novelli Public Services through PN View: 360; respondents could select multiple responses to the question (all response options shown). Selection of the response “none of these” was exclusive (i.e., respondents could not select this response option in addition to other responses). The figure is a horizontal bar graph indicating knowledge about safe use of cleaning/disinfectant products in the United States, based on responses of 502 persons to an opt-in Internet panel survey administered in May 2020. 
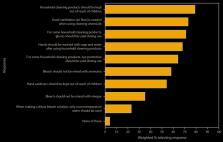
Respondents reported engaging in a range of practices during the previous month with the intent of preventing SARS-CoV-2 transmission (Figure 2). Sixty percent of respondents reported more frequent home cleaning or disinfection compared with that in preceding months. Thirty-nine percent reported intentionally engaging in at least one high-risk practice not recommended by CDC for prevention of SARS-CoV-2 transmission ( 2 ), including application of bleach to food items (e.g., fruits and vegetables) (19%); use of household cleaning and disinfectant products on hands or skin (18%); misting the body with a cleaning or disinfectant spray (10%); inhalation of vapors from household cleaners or disinfectants (6%); and drinking or gargling diluted bleach solutions, soapy water, and other cleaning and disinfectant solutions (4% each). FIGURE 2 Cleaning and disinfection practices in the previous month with the intent of preventing SARS-CoV-2 infection,* , † based on responses to an opt-in Internet panel survey § (N = 502 respondents) — United States, May 2020 * In response to the question “In the past month, which of the following cleaning behaviors have you or a household member engaged in to prevent coronavirus?” † In survey questions, the term “cleaning” referred to using a cleaner or disinfectant on surfaces or objects. § Survey administered by Porter Novelli Public Services through PN View: 360; respondents could select multiple responses to the question (nine of 11 possible response options shown). Selection of the response “none of these” was exclusive (i.e., respondents could not select this response option in addition to other responses). The figure is a horizontal bar graph showing the cleaning and infection practices employed by U.S. persons in the previous month with the intent of preventing SARS-CoV-2 infection, based on responses of 502 persons to an opt-in Internet panel survey administered in May 2020. One quarter (25%) of respondents reported at least one adverse health effect during the previous month that they believed had resulted from using cleaners or disinfectants, including nose or sinus irritation (11%); skin irritation (8%); eye irritation (8%); dizziness, lightheadedness, or headache (8%); upset stomach or nausea (6%); or breathing problems (6%). Respondents who reported engaging in at least one high-risk practice more frequently reported an adverse health effect than did those who did not report engaging in such practices (39% versus 16%). Approximately half (51%) of respondents strongly agreed and 31% somewhat agreed that they knew how to clean and disinfect their home safely. Similarly, 42% strongly agreed and 35% somewhat agreed that they knew how to clean and disinfect their home to prevent SARS-CoV-2 transmission. When asked who their most trusted sources of SARS-CoV-2-related cleaning and disinfection information were, the top three responses were CDC (65%), state or local health departments (49%), and doctors, nurses, or medical providers (48%). Discussion This survey identified important knowledge gaps in the safe use of cleaners and disinfectants among U.S. adults; the largest gaps were found in knowledge about safe preparation of cleaning and disinfectant solutions and about storage of hand sanitizers out of the reach of children. Mixing of bleach solutions with vinegar or ammonia, as well as application of heat, can generate chlorine and chloramine gases that might result in severe lung tissue damage when inhaled ( 4 , 5 ). Furthermore, exposures of children to hand sanitizers, particularly via ingestion, can be associated with irritation of mucous membranes, gastrointestinal effects, and in severe cases, alcohol toxicity ( 6 ). The risk of ingestion and consequent toxicity from improperly stored hand sanitizers, cleaners, and disinfectants can also extend to pets ( 7 ). Consistent with current guidance for daily cleaning and disinfection of frequently touched surfaces ( 2 ), a majority of respondents reported increased frequency of cleaning in the home. However, approximately one third reported engaging in high-risk practices such as washing food products with bleach, applying household cleaning and disinfectant products to bare skin, and intentionally inhaling or ingesting cleaners or disinfectants. These practices pose a risk of severe tissue damage and corrosive injury ( 8 , 9 ) and should be strictly avoided. Although adverse health effects reported by respondents could not be attributed to their engaging in high-risk practices, the association between these high-risk practices and reported adverse health effects indicates a need for public messaging regarding safe and effective cleaning and disinfection practices aimed at preventing SARS-CoV-2 transmission in households. COVID-19 prevention messages should continue to emphasize evidence-based, safe practices such as frequent hand hygiene and frequent cleaning and disinfection of high-touch surfaces ( 2 ). These messages should include specific recommendations for the safe use of cleaners and disinfectants, including the importance of reading and following label instructions, using water at room temperature for dilution (unless otherwise stated on the label), avoiding mixing of chemical products, wearing skin protection and considering eye protection for potential splash hazards, ensuring adequate ventilation, and storing and using chemicals and hand sanitizers out of the reach of children and pets ( 10 ). Despite the knowledge gaps and high-risk practices identified in this survey, most respondents believed that they knew how to clean and disinfect their homes safely; thus, prevention messages should highlight identified gaps in knowledge about safe and effective practices and provide targeted information using innovative communication strategies (e.g., digital, social media) regarding safe cleaning and disinfection. These messages about cleaning and disinfection practices for COVID-19 prevention can be coordinated and disseminated through trusted sources of information such as national, state, and local public health agencies and medical providers. The findings in this report are subject to at least four limitations. First, although survey responses were weighted to be nationally representative of U.S. demographics, whether responses among this opt-in panel sample are truly representative of knowledge, attitudes, and practices shared by the broader U.S. population is difficult to determine. Second, social desirability bias might have affected responses, with some respondents potentially overstating their perceived knowledge or underreporting engagement in high-risk practices; thus, these findings might underestimate the risk for exposures. Third, cross-sectional data captured in survey responses do not allow for direct attribution of specific outcomes, such as adverse health effects, to specific knowledge gaps or practices. Finally, responses were recorded at a single point in time and might not reflect ongoing shifts in public opinion or cleaning and disinfection practices by the public throughout the national COVID-19 response. Efforts are ongoing to collect these data over time and to characterize knowledge gaps and practices among specific demographic and geographic groups. These data will allow for development and evaluation of further targeted messaging to ensure safe cleaning and disinfection practices in U.S. households during and after the COVID-19 pandemic. Summary What is already known about this topic? Calls to poison centers regarding exposures to cleaners and disinfectants have increased since the onset of the COVID-19 pandemic. What is added by this report? An Internet panel survey identified gaps in knowledge about safe preparation, use, and storage of cleaners and disinfectants. Approximately one third of survey respondents engaged in nonrecommended high-risk practices with the intent of preventing SARS-CoV-2 transmission, including using bleach on food products, applying household cleaning and disinfectant products to skin, and inhaling or ingesting cleaners and disinfectants. What are the implications for public health practice? Public messaging should continue to emphasize evidence-based, safe cleaning and disinfection practices to prevent SARS-CoV-2 transmission in households, including hand hygiene and cleaning and disinfection of high-touch surfaces.

          Related collections

          Most cited references5

          • Record: found
          • Abstract: found
          • Article: found
          Is Open Access

          Cleaning and Disinfectant Chemical Exposures and Temporal Associations with COVID-19 — National Poison Data System, United States, January 1, 2020–March 31, 2020

          On January 19, 2020, the state of Washington reported the first U.S. laboratory-confirmed case of coronavirus disease 2019 (COVID-19) caused by infection with SARS-CoV-2 ( 1 ). As of April 19, a total of 720,630 COVID-19 cases and 37,202 associated deaths* had been reported to CDC from all 50 states, the District of Columbia, and four U.S. territories ( 2 ). CDC recommends, with precautions, the proper cleaning and disinfection of high-touch surfaces to help mitigate the transmission of SARS-CoV-2 ( 3 ). To assess whether there might be a possible association between COVID-19 cleaning recommendations from public health agencies and the media and the number of chemical exposures reported to the National Poison Data System (NPDS), CDC and the American Association of Poison Control Centers surveillance team compared the number of exposures reported for the period January–March 2020 with the number of reports during the same 3-month period in 2018 and 2019. Fifty-five poison centers in the United States provide free, 24-hour professional advice and medical management information regarding exposures to poisons, chemicals, drugs, and medications. Call data from poison centers are uploaded in near real-time to NPDS. During January–March 2020, poison centers received 45,550 exposure calls related to cleaners (28,158) and disinfectants (17,392), representing overall increases of 20.4% and 16.4% from January–March 2019 (37,822) and January–March 2018 (39,122), respectively. Although NPDS data do not provide information showing a definite link between exposures and COVID-19 cleaning efforts, there appears to be a clear temporal association with increased use of these products. The daily number of calls to poison centers increased sharply at the beginning of March 2020 for exposures to both cleaners and disinfectants (Figure). The increase in total calls was seen across all age groups; however, exposures among children aged ≤5 years consistently represented a large percentage of total calls in the 3-month study period for each year (range = 39.9%–47.3%) (Table). Further analysis of the increase in calls from 2019 to 2020 (3,137 for cleaners, 4,591 for disinfectants), showed that among all cleaner categories, bleaches accounted for the largest percentage of the increase (1,949; 62.1%), whereas nonalcohol disinfectants (1,684; 36.7%) and hand sanitizers (1,684; 36.7%) accounted for the largest percentages of the increase among disinfectant categories. Inhalation represented the largest percentage increase from 2019 to 2020 among all exposure routes, with an increase of 35.3% (from 4,713 to 6,379) for all cleaners and an increase of 108.8% (from 569 to 1,188) for all disinfectants. Two illustrative case vignettes are presented to highlight the types of chemical exposure calls managed by poison centers. FIGURE Number of daily exposures to cleaners and disinfectants reported to U.S. poison centers — United States, January–March 2018, 2019, and 2020* ,† * Excluding February 29, 2020. † Increase in exposures to cleaners on January 29, 2020, came from an unintentional exposure to a cleaning agent within a school. The figure consists of two side-by-side line graphs, comparing the number of daily exposures to cleaners and disinfectants reported to U.S. poison centers during January–March of 2018, 2019, and 2020. TABLE Number and percentage of exposures to cleaners and disinfectants reported to U.S. poison centers, by selected characteristics — United States, January–March 2018, 2019, and 2020 Characteristic No. (%) Cleaners Disinfectants 2018 2019 2020 2018 2019 2020 Total 25,583 (100.0) 25,021 (100.0) 28,158 (100.0) 13,539 (100.0) 12,801 (100.0) 17,392 (100.0) Age group (yrs) 0–5 10,926 (42.7) 10,207 (40.8) 10,039 (35.7) 7,588 (56.0) 6,802 (53.1) 8,158 (46.9) 6–19 2,655 (10.4) 2,464 (9.8) 2,516 (8.9) 1,803 (13.3) 1,694 (13.2) 2,358 (13.6) 20–59 8,072 (31.6) 8,203 (32.8) 9,970 (35.4) 2,659 (19.6) 2,791 (21.8) 4,056 (23.3) ≥60 1,848 (7.2) 1,936 (7.7) 2,356 (8.4) 929 (6.9) 848 (6.6) 1,455 (8.4) Unknown 2,082 (8.1) 2,211 (8.8) 3,277 (11.6) 560 (4.1) 666 (5.2) 1,365 (7.8) Exposure route* Ingestion 16,384 (64.0) 15,710 (62.8) 16,535 (58.7) 11,714 (86.5) 10,797 (84.3) 13,993 (80.5) Inhalation 4,747 (18.6) 4,713 (18.8) 6,379 (22.7) 540 (4.0) 569 (4.4) 1,188 (6.8) Dermal 4,349 (17.0) 4,271 (17.1) 4,785 (17.0) 1,085 (8.0) 1,078 (8.4) 1,695 (9.7) Ocular 3,355 (13.1) 3,407 (13.6) 3,802 (13.5) 984 (7.3) 1,067 (8.3) 1,533 (8.8) Other/Unknown 182 (0.7) 169 (0.7) 166 (0.6) 89 (0.7) 95 (0.7) 147 (0.8) *Exposure might have more than one route. Case 1 An adult woman heard on the news to clean all recently purchased groceries before consuming them. She filled a sink with a mixture of 10% bleach solution, vinegar, and hot water, and soaked her produce. While cleaning her other groceries, she noted a noxious smell described as “chlorine” in her kitchen. She developed difficulty breathing, coughing, and wheezing, and called 911. She was transported to the emergency department (ED) via ambulance and was noted to have mild hypoxemia and end-expiratory wheezing. She improved with oxygen and bronchodilators. Her chest radiograph was unremarkable, and she was discharged after a few hours of observation. Case 2 A preschool-aged child was found unresponsive at home and transported to the ED via ambulance. A 64-ounce bottle of ethanol-based hand sanitizer was found open on the kitchen table. According to her family, she became dizzy after ingesting an unknown amount, fell and hit her head. She vomited while being transported to the ED, where she was poorly responsive. Her blood alcohol level was elevated at 273 mg/dL (most state laws define a limit of 80 mg/dL for driving under the influence); neuroimaging did not indicate traumatic injuries. She was admitted to the pediatric intensive care unit overnight, had improved mental status, and was discharged home after 48 hours. The findings in this report are subject to at least two limitations. First, NPDS data likely underestimate the total incidence and severity of poisonings, because they are limited to persons calling poison centers for assistance. Second, data on the direct attribution of these exposures to efforts to prevent or treat COVID-19 are not available in NPDS. Although a causal association cannot be demonstrated, the timing of these reported exposures corresponded to increased media coverage of the COVID-19 pandemic, reports of consumer shortages of cleaning and disinfection products ( 4 ), and the beginning of some local and state stay-at-home orders. Exposures to cleaners and disinfectants reported to NPDS increased substantially in early March 2020. Associated with increased use of cleaners and disinfectants is the possibility of improper use, such as using more than directed on the label, mixing multiple chemical products together, not wearing protective gear, and applying in poorly ventilated areas. To reduce improper use and prevent unnecessary chemical exposures, users should always read and follow directions on the label, only use water at room temperature for dilution (unless stated otherwise on the label), avoid mixing chemical products, wear eye and skin protection, ensure adequate ventilation, and store chemicals out of the reach of children.
            Bookmark
            • Record: found
            • Abstract: not found
            • Article: not found

            The clinical toxicology of sodium hypochlorite

              Bookmark
              • Record: found
              • Abstract: found
              • Article: found
              Is Open Access

              Reported Adverse Health Effects in Children from Ingestion of Alcohol-Based Hand Sanitizers — United States, 2011–2014

              Hand sanitizers are effective and inexpensive products that can reduce microorganisms on the skin, but ingestion or improper use can be associated with health risks. Many hand sanitizers contain up to 60%–95% ethanol or isopropyl alcohol by volume, and are often combined with scents that might be appealing to young children. Recent reports have identified serious consequences, including apnea, acidosis, and coma in young children who swallowed alcohol-based (alcohol) hand sanitizer ( 1 – 3 ). Poison control centers collect data on intentional and unintentional exposures to hand sanitizer solutions resulting from various routes of exposure, including ingestion, inhalation, and dermal and ocular exposures. To characterize exposures of children aged ≤12 years to alcohol hand sanitizers, CDC analyzed data reported to the National Poison Data System (NPDS).* The major route of exposure to both alcohol and nonalcohol-based (nonalcohol) hand sanitizers was ingestion. The majority of intentional exposures to alcohol hand sanitizers occurred in children aged 6–12 years. Alcohol hand sanitizer exposures were associated with worse outcomes than were nonalcohol hand sanitizer exposures. Caregivers and health care providers should be aware of the potential dangers associated with hand sanitizer ingestion. Children using alcohol hand sanitizers should be supervised and these products should be kept out of reach from children when not in use. In 2005, the annual rate of intentional alcohol hand sanitizer exposure was 0.68 per 1 million U.S. residents (95% confidence interval [CI] = 0.17–1.20) ( 4 ). During 2005–2009, this rate increased, on average, by 0.32 per 1 million per year (95% CI = 0.11–0.53; p = 0.02) ( 4 ). Young children, including infants, are more likely to develop complications from alcohol intoxication than are older children and teens. Younger children have decreased liver glycogen stores, which increase their risk of developing hypoglycemia, and have various pharmokinetic factors, which make them more susceptible to developing toxicity from alcohol ( 5 – 9 ). To characterize pediatric alcohol hand sanitizer exposures in the United States, data reported by poison centers in all states to NPDS among children aged ≤12 years during January 1, 2011–December 31, 2014 were analyzed. Analyses were stratified by age group (0–5 years and 6–12 years). Hand sanitizer exposures were defined as a poison center call reporting an exposure to either ethanol-based or isopropanol-based sanitizer solutions (alcohol hand sanitizer exposure) or a nonalcohol sanitizer product (nonalcohol hand sanitizer exposure). Calls reporting co-exposures to other agents were excluded to minimize confounding effects. Descriptive statistics were compiled for exposed children’s age, year and season of exposure, intentionality of exposure, route of exposure (ingestion, inhalation, dermal, or ocular), reported health effects (e.g., drowsiness, eye irritation, nausea, vomiting, etc.), and outcome, † and were compared for alcohol and nonalcohol hand sanitizers and age group. An exposure was coded by poison centers as unintentional if it was considered to be accidental or inadvertent. Deliberate exposures, because of deliberate misuse or abuse for example, were considered intentional. An exposure was considered to have resulted in an adverse health effect if at least one symptom (e.g., abdominal pain, nausea, vomiting, etc.) was reported. Categorical data comparisons were performed using the chi-square test or, when cell sizes were <5, Fisher’s exact test. Significance was defined as p<0.05. Statistical software was used for the analysis. During 2011–2014, a total of 70,669 hand sanitizer exposures in children aged ≤12 years were reported to NPDS, including 65,293 (92%) alcohol exposures, and 5,376 (8%) nonalcohol exposures (Table 1). The number and percentage of each type of reported exposure was similar during each of the 4 years. Overall, 64,488 (91%) exposures occurred in children aged ≤5 years, and 6,181 (9%) occurred in children aged 6–12 years. There was no association between sanitizer type and year. Among all children, ingestion accounted for approximately 95% of reported exposures, including 97% of exposures among children aged ≤5 years (97.0% alcohol and 96.3% nonalcohol exposures) and 74% among children aged 6–12 years (74.0% alcohol and 72.0% nonalcohol exposures). A higher percentage of older children (aged 6–12 years) had intentional exposures to alcohol hand sanitizers (866; 15.0%) than to nonalcohol hand sanitizers (40; 8.0%) (p<0.001). This association was not found in younger children (aged ≤5 years). Ocular exposures to hand sanitizers were more common in older children (24.8% overall, 24.4% alcohol, and 29.0% nonalcohol) than among younger children (3.0% overall, 3.0% alcohol, and 3.2% nonalcohol). Although there was no seasonal variation in reported exposure to either hand sanitizer type among younger children, exposure frequency among older children was lower for both hand sanitizer types during the summer months (Figure). TABLE 1 Exposures to alcohol and nonalcohol hand sanitizer products among children aged ≤12 years reported to poison centers, by sanitizer type, year, age group, exposure route, and intentionality — United States, National Poison Data System, 2011–2014 Year No. (%) of exposures Alcohol Nonalcohol Total Total 65,293 (92.4) 5,376 (7.6) 70,669 2011 15,971 (92.5) 1,286 (7.5) 17,257 2012 16,571 (92.4) 1,355 (7.6) 17,926 2013 16,423 (92.5) 1,338 (7.5) 17,761 2014 16,328 (92.1) 1,397 (7.9) 17,725 Age group 0–5 yrs Total 59,612 (92.4) 4,876 (7.6) 64,488 (91.2)* Exposure route Ingestion 57,825 (97.0) 4,698 (96.3) 62,523 (97.0) Inhalation 74 (0.1) 10 (0.2) 84 (0.1) Dermal 2,385 (4.0) 135 (2.8) 2,520 (3.9) Ocular 1,782 (3.0) 157 (3.2) 1,939 (3.0) Intentionality Intentional 37 (0.1) 1 (0.0) 38 (0.1) Unintentional 59,575 (99.9) 4,875 (100.0) 64,450 (99.9) Age group 6–12 yrs Total 5,681 (91.9) 500 (8.1) 6,181 (8.7)* Exposure route Ingestion 4,204 (74.0) 351 (70.2) 4,555 (74.0) Inhalation 81 (1.4) 6 (1.2) 87 (1.4) Dermal 180 (3.2) 9 (1.8) 189 (3.1) Ocular 1,387 (24.4) 145 (29.0) 1,532 (24.8) Intentionality Intentional 866 (15.2) 40 (8.0) 906 (14.7) Unintentional 4,815 (84.8) 460 (92.0) 5,275 (85.3) *Percentage of total exposures. FIGURE Percentage of exposures from alcohol-based and nonalcohol-based hand sanitizer products in children aged ≤5 years and aged 6–12 years reported to poison centers, by month — United States, National Poison Data System, January 1, 2011–December 31, 2014 The figure above is a line chart showing the percentage of exposures from alcohol-based and nonalcohol-based hand sanitizer products in children aged ≤5 years and 6–12 years reported to poison centers, by month, in the United States during January 1, 2011–December 31, 2014. Overall, 8,219 (12%) patients had at least one reported symptom, including 7,703 (12%) children who ingested alcohol products, and 516 (10%) who ingested nonalcohol products. Adverse health effects were more likely to be reported for alcohol hand sanitizer exposures (p<0.001). The most common adverse health effects for both hand sanitizer types were ocular irritation (2,577; 31.4%) and vomiting (1,872; 22.8%). Conjunctivitis (862; 10.5%), oral irritation (782; 9.5%), cough (705; 8.6%), and abdominal pain (323; 3.9%) were also reported (Table 2). Rare health effects included coma (five), seizures (three), hypoglycemia (two), metabolic acidosis (two), and respiratory depression (two). Those rare effects occurred more frequently among children with alcohol hand sanitizer exposures, but the differences were not statistically significant when the rare health effects were analyzed individually. Alcohol hand sanitizers were significantly associated with worse outcomes (compared with no effect outcomes) when both age groups were analyzed (p = 0.02). Approximately two thirds (66%) of children with exposures were not followed to determine outcome (Table 2). Among patients who were followed (23,828), exposure to alcohol hand sanitizers had no reported effect in 17,441 (85%) of the younger children. In contrast, 1,005 (50%) of the older children had no reported effect to alcohol hand sanitizer exposure. No deaths were reported. TABLE 2 Most common adverse health effects and outcomes experienced by children with exposure to alcohol and nonalcohol hand sanitizers, by age group — United States, 2011–2014 Characteristic No. (%) Alcohol Nonalcohol Alcohol Nonalcohol Total <5 yrs <5 yrs 6–12 yrs 6–12 yrs Total 59,612 4,876 5,681 500 70,669 Symptoms Reported symptoms 5,867 (9.8) 379 (7.8) 1,836 (32.3) 137 (27.4) 8,219 (11.6) Ocular irritation 1,306 (22.3)* 97 (25.6)* 1,080 (58.8)* 94 (68.6)* 2,577 (31.4) Vomiting 1,606 (27.4)* 129 (34.0)* 129 (7.0) 8 (5.8)* 1,872 (22.8) Red eye/Conjunctivitis 492 (8.4) 33 (8.7) 316 (17.2)* 21 (15.3)* 862 (10.5) Oral irritation 699 (11.9)* 26 (6.9) 55 (3.0) 2 (1.5) 782 (9.5) Cough 651 (11.1) 43 (11.4)* 11 (0.6) 0 (0.0) 705 (8.6) Abdominal pain 173 (3.0) 10 (2.6) 135 (7.4)* 5 (3.7) 323 (3.9) Outcomes No effect 17,441 (29.3) 956 (19.6) 1,005 (17.7) 71 (14.2) 19,473 (27.6) Minor outcome† 2,957 (5.0) 188 (3.9) 962 (16.9) 85 (17.0) 4,192 (5.9) Moderate outcome§ 105 (0.2) 4 (0.1) 45 (0.8) 4 (0.8) 158 (0.2) Major outcome¶ 4 (0.0) 0 (0.0) 1 (0.0) 0 (0.0) 5 (0.0) Not followed 39,105 (65.6) 3,728 (76.5) 3,668 (64.6) 340 (68.0) 46,841 (66.3) * The three most commonly reported symptoms per column. † The patient exhibited some symptoms as a result of the exposure, but they were minimally bothersome to the patient. The symptoms usually resolved rapidly and often involved skin or mucous membrane manifestations. The patient returned to a preexposure state of well-being and had no residual disability or disfigurement. § The patient exhibited symptoms as a result of the exposure that were more pronounced, more prolonged, or more of a systemic nature than minor symptoms. Usually some form of treatment was or would have been indicated. Symptoms were not life-threatening and the patient returned to a preexposure state of well-being with no residual disability or disfigurement. ¶ The patient exhibited symptoms as a result of the exposure that were life-threatening or resulted in significant residual disability or disfigurement. Discussion In this analysis, alcohol hand sanitizer exposures, the majority of which were ingestions, were associated with worse outcomes than nonalcohol hand sanitizer exposures. Older children (aged 6–12 years) were more likely to report intentional ingestion and to have adverse health effects and worse outcomes than were younger children, suggesting that older children might be deliberately misusing or abusing alcohol hand sanitizers. These data also indicate that, among older children, exposures occur less frequently during the summer months. The reason for this seasonal trend is unknown but might be associated with flu season or more ready access to hand sanitizers during the school year. Some schools might require or ask children to purchase and carry hand sanitizers, which might contribute to the higher number of exposures during the school year. A study examining Texas poison center data from 2000 to 2013 found that, among 385 adolescents who ingested hand sanitizer, 35% of ingestions occurred at school ( 10 ). The findings in this report are subject to at least three limitations, which might have led to an underestimate of the total number of alcohol and nonalcohol hand sanitizer exposures. First, calls involving hand sanitizer exposures and another exposure were excluded. Second, the codes indicating an alcohol hand sanitizer exposure also were changed in 2010 and might have been initially underused. Finally, public and health care providers, including emergency department providers, also might not have reported all alcohol or nonalcohol hand sanitizer exposures to poison centers. Moreover, poison center data are also subject to inherent biases such as selection bias (e.g., if poisoning is unrecognized as a cause) or information bias (e.g., recall or interviewer bias). An important example of information bias in this study could be exposure intentionality being incorrectly coded because of inaccurate or subjective history obtained by the caller. Hand washing with soap and water is the recommended method of hand hygiene in non–health care settings. If soap and water are not available, use of a hand sanitizer that contains at least 60% alcohol is suggested. § Other options, such as nonalcohol hand sanitizers or wipes, can be used if soap and water or alcohol hand sanitizers are not available or practical. In September 2016, the Food and Drug Administration issued a rule banning the use of triclosan, triclocarban, and 17 other chemicals in consumer hand and body antibacterial soaps and washes because of health and bacterial resistance concerns. However, this ban does not apply to hand sanitizers, hand wipes, or antibacterial soaps used in a health care setting. ¶ Hand washing with plain soap and water is safe and effective and does not carry these associated risks. Increasing awareness of the potential dangers associated with intentional or unintentional ingestion of alcohol hand sanitizers might help encourage proper use and avoid adverse outcomes. Using alcohol hand sanitizers correctly, under adult supervision, and with proper child safety precautions and making sure they are stored out of reach of young children might reduce unintended adverse consequences. Clinicians evaluating pediatric patients with clinical signs and symptoms consistent with alcohol toxicity, such as nausea, vomiting, respiratory depression, and drowsiness or laboratory results consistent with ethanol or isopropanol toxicity, should consider the possibility of an alcohol hand sanitizer ingestion and contact their local poison control center. Summary What is already known about this topic? Nonrecommended use of alcohol-based (alcohol) hand sanitizers, including intentional or unintentional ingestion, might be associated with greater health risks in young children than similar use of nonalcohol-based (nonalcohol) hand sanitizers. What is added by this report? During 2011–2014, 70,669 exposures to alcohol and nonalcohol hand sanitizers were reported in children aged ≤12 years to the National Poison Data System. Approximately 90% of these exposures occurred among children aged 0–5 years. Among that age group, 97% of exposures were oral ingestions. Children aged 6–12 years had more intentional exposures of alcohol hand sanitizers, suggesting this might be a potential product of abuse among older children. Older children also reported more symptoms and had worse outcomes than did younger children. Major (life-threatening) outcomes were rare. Seasonal trends in data might correlate with increased use during the school year or flu season. What are the implications for public health practice? Caregivers and health care providers need to be aware of the potential risks and dangers associated with improper use of hand sanitizer products among children and the need to use proper safety precautions to protect children. Increased parental or teacher supervision might be needed while using alcohol hand sanitizer products, especially for older children who might be abusing these products during the school year.
                Bookmark

                Author and article information

                Journal
                MMWR Morb Mortal Wkly Rep
                MMWR Morb. Mortal. Wkly. Rep
                WR
                Morbidity and Mortality Weekly Report
                Centers for Disease Control and Prevention
                0149-2195
                1545-861X
                12 June 2020
                12 June 2020
                : 69
                : 23
                : 705-709
                Affiliations
                COVID-19 Response Team, CDC; Epidemic Intelligence Service, CDC; Division of Environmental Health Science and Practice, National Center for Environmental Health, CDC.
                Author notes
                Corresponding author: Radhika Gharpure, rgharpure@ 123456cdc.gov , 404-718-7213.
                Article
                mm6923e2
                10.15585/mmwr.mm6923e2
                7315790
                32525852
                dbb27ff8-1913-41ff-ba46-199845cafb08

                All material in the MMWR Series is in the public domain and may be used and reprinted without permission; citation as to source, however, is appreciated.

                History
                Categories
                Full Report

                Comments

                Comment on this article