11
views
0
recommends
+1 Recommend
1 collections
    0
    shares
      • Record: found
      • Abstract: found
      • Article: found
      Is Open Access

      Analysis and Evaluation of COVID-19 Web Applications for Health Professionals: Challenges and Opportunities

      research-article

      Read this article at

      Bookmark
          There is no author summary for this article yet. Authors can add summaries to their articles on ScienceOpen to make them more accessible to a non-specialist audience.

          Abstract

          The multidisciplinary nature of the work required for research in the COVID-19 pandemic has created new challenges for health professionals in the battle against the virus. They need to be equipped with novel tools, applications, and resources—that have emerged during the pandemic—to gain access to breakthrough findings; know the latest developments; and to address their specific needs for rapid data acquisition, analysis, evaluation, and reporting. Because of the complex nature of the virus, healthcare systems worldwide are severely impacted as the treatment and the vaccine for COVID-19 disease are not yet discovered. This leads to frequent changes in regulations and policies by governments and international organizations. Our analysis suggests that given the abundance of information sources, finding the most suitable application for analysis, evaluation, or reporting, is one of such challenges. However, health professionals and policy-makers need access to the most relevant, reliable, trusted, and latest information and applications that can be used in their day-to-day tasks of COVID-19 research and analysis. In this article, we present our analysis of various novel and important web-based applications that have been specifically developed during the COVID-19 pandemic and that can be used by the health professionals community to help in advancing their analysis and research. These applications comprise search portals and their associated information repositories for literature and clinical trials, data sources, tracking dashboards, and forecasting models. We present a list of the minimally essential online, web-based applications to serve a multitude of purposes, from hundreds of those developed since the beginning of the pandemic. A critical analysis is provided for the selected applications based on 17 features that can be useful for researchers and analysts for their evaluations. These features make up our evaluation framework and have not been used previously for analysis and evaluation. Therefore, knowledge of these applications will not only increase productivity but will also allow us to explore new dimensions for using existing applications with more control, better management, and greater outcome of their research. In addition, the features used in our framework can be applied for future evaluations of similar applications and health professionals can adapt them for evaluation of other applications not covered in this analysis.

          Related collections

          Most cited references53

          • Record: found
          • Abstract: found
          • Article: not found

          An interactive web-based dashboard to track COVID-19 in real time

          In December, 2019, a local outbreak of pneumonia of initially unknown cause was detected in Wuhan (Hubei, China), and was quickly determined to be caused by a novel coronavirus, 1 namely severe acute respiratory syndrome coronavirus 2 (SARS-CoV-2). The outbreak has since spread to every province of mainland China as well as 27 other countries and regions, with more than 70 000 confirmed cases as of Feb 17, 2020. 2 In response to this ongoing public health emergency, we developed an online interactive dashboard, hosted by the Center for Systems Science and Engineering (CSSE) at Johns Hopkins University, Baltimore, MD, USA, to visualise and track reported cases of coronavirus disease 2019 (COVID-19) in real time. The dashboard, first shared publicly on Jan 22, illustrates the location and number of confirmed COVID-19 cases, deaths, and recoveries for all affected countries. It was developed to provide researchers, public health authorities, and the general public with a user-friendly tool to track the outbreak as it unfolds. All data collected and displayed are made freely available, initially through Google Sheets and now through a GitHub repository, along with the feature layers of the dashboard, which are now included in the Esri Living Atlas. The dashboard reports cases at the province level in China; at the city level in the USA, Australia, and Canada; and at the country level otherwise. During Jan 22–31, all data collection and processing were done manually, and updates were typically done twice a day, morning and night (US Eastern Time). As the outbreak evolved, the manual reporting process became unsustainable; therefore, on Feb 1, we adopted a semi-automated living data stream strategy. Our primary data source is DXY, an online platform run by members of the Chinese medical community, which aggregates local media and government reports to provide cumulative totals of COVID-19 cases in near real time at the province level in China and at the country level otherwise. Every 15 min, the cumulative case counts are updated from DXY for all provinces in China and for other affected countries and regions. For countries and regions outside mainland China (including Hong Kong, Macau, and Taiwan), we found DXY cumulative case counts to frequently lag behind other sources; we therefore manually update these case numbers throughout the day when new cases are identified. To identify new cases, we monitor various Twitter feeds, online news services, and direct communication sent through the dashboard. Before manually updating the dashboard, we confirm the case numbers with regional and local health departments, including the respective centres for disease control and prevention (CDC) of China, Taiwan, and Europe, the Hong Kong Department of Health, the Macau Government, and WHO, as well as city-level and state-level health authorities. For city-level case reports in the USA, Australia, and Canada, which we began reporting on Feb 1, we rely on the US CDC, the government of Canada, the Australian Government Department of Health, and various state or territory health authorities. All manual updates (for countries and regions outside mainland China) are coordinated by a team at Johns Hopkins University. The case data reported on the dashboard aligns with the daily Chinese CDC 3 and WHO situation reports 2 for within and outside of mainland China, respectively (figure ). Furthermore, the dashboard is particularly effective at capturing the timing of the first reported case of COVID-19 in new countries or regions (appendix). With the exception of Australia, Hong Kong, and Italy, the CSSE at Johns Hopkins University has reported newly infected countries ahead of WHO, with Hong Kong and Italy reported within hours of the corresponding WHO situation report. Figure Comparison of COVID-19 case reporting from different sources Daily cumulative case numbers (starting Jan 22, 2020) reported by the Johns Hopkins University Center for Systems Science and Engineering (CSSE), WHO situation reports, and the Chinese Center for Disease Control and Prevention (Chinese CDC) for within (A) and outside (B) mainland China. Given the popularity and impact of the dashboard to date, we plan to continue hosting and managing the tool throughout the entirety of the COVID-19 outbreak and to build out its capabilities to establish a standing tool to monitor and report on future outbreaks. We believe our efforts are crucial to help inform modelling efforts and control measures during the earliest stages of the outbreak.
            Bookmark
            • Record: found
            • Abstract: found
            • Article: found
            Is Open Access

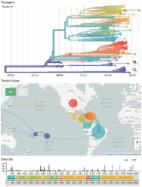
            Nextstrain: real-time tracking of pathogen evolution

            Abstract Summary Understanding the spread and evolution of pathogens is important for effective public health measures and surveillance. Nextstrain consists of a database of viral genomes, a bioinformatics pipeline for phylodynamics analysis, and an interactive visualization platform. Together these present a real-time view into the evolution and spread of a range of viral pathogens of high public health importance. The visualization integrates sequence data with other data types such as geographic information, serology, or host species. Nextstrain compiles our current understanding into a single accessible location, open to health professionals, epidemiologists, virologists and the public alike. Availability and implementation All code (predominantly JavaScript and Python) is freely available from github.com/nextstrain and the web-application is available at nextstrain.org.
              Bookmark
              • Record: found
              • Abstract: found
              • Article: not found

              PubTator central: automated concept annotation for biomedical full text articles

              PubTator Central (https://www.ncbi.nlm.nih.gov/research/pubtator/) is a web service for viewing and retrieving bioconcept annotations in full text biomedical articles. PubTator Central (PTC) provides automated annotations from state-of-the-art text mining systems for genes/proteins, genetic variants, diseases, chemicals, species and cell lines, all available for immediate download. PTC annotates PubMed (29 million abstracts) and the PMC Text Mining subset (3 million full text articles). The new PTC web interface allows users to build full text document collections and visualize concept annotations in each document. Annotations are downloadable in multiple formats (XML, JSON and tab delimited) via the online interface, a RESTful web service and bulk FTP. Improved concept identification systems and a new disambiguation module based on deep learning increase annotation accuracy, and the new server-side architecture is significantly faster. PTC is synchronized with PubMed and PubMed Central, with new articles added daily. The original PubTator service has served annotated abstracts for ∼300 million requests, enabling third-party research in use cases such as biocuration support, gene prioritization, genetic disease analysis, and literature-based knowledge discovery. We demonstrate the full text results in PTC significantly increase biomedical concept coverage and anticipate this expansion will both enhance existing downstream applications and enable new use cases.
                Bookmark

                Author and article information

                Journal
                Healthcare (Basel)
                Healthcare (Basel)
                healthcare
                Healthcare
                MDPI
                2227-9032
                07 November 2020
                December 2020
                : 8
                : 4
                : 466
                Affiliations
                [1 ]Department of Computer Science, SEECS, National University of Sciences and Technology (NUST), Islamabad 44000, Pakistan
                [2 ]Department of Computer Science, College of CIT, Taif University, Taif 21944, Saudi Arabia
                [3 ]College of Computer Sciences and Information Technology (CCSIT), King Faisal University, Alahssa 31982, Saudi Arabia; hfahmad@ 123456kfu.edu.sa
                [4 ]Department of Computer Science & I.T, University of Malakand, Chakdara 18800, Pakistan; mzahidkhan@ 123456uom.edu.pk
                [5 ]Department of Electrical Engineering, College of Engineering, Taif University, P.O. Box 11099, Taif 21944, Saudi Arabia; nasimullah@ 123456tu.edu.sa
                Author notes
                [* ]Correspondence: h.mukhtar@ 123456tu.edu.sa
                Author information
                https://orcid.org/0000-0002-9367-4340
                https://orcid.org/0000-0002-8545-9771
                https://orcid.org/0000-0002-1171-1794
                https://orcid.org/0000-0001-7208-6374
                Article
                healthcare-08-00466
                10.3390/healthcare8040466
                7712438
                33171711
                d87424c1-a31b-48d2-aa9a-4f02838e8643
                © 2020 by the authors.

                Licensee MDPI, Basel, Switzerland. This article is an open access article distributed under the terms and conditions of the Creative Commons Attribution (CC BY) license ( http://creativecommons.org/licenses/by/4.0/).

                History
                : 29 September 2020
                : 02 November 2020
                Categories
                Article

                api,dashboard,interface,metadata,visualization
                api, dashboard, interface, metadata, visualization

                Comments

                Comment on this article