55
views
0
recommends
+1 Recommend
2 collections
    0
    shares
      • Record: found
      • Abstract: found
      • Article: found

      European Society of Cardiology: cardiovascular disease statistics 2021

      , , , , , , , , , , , , , , , , , , , , , , , , , , , , , , , , , , , , , , , , , , , , , , , , , , , , , , , , , , , , , , , , , , , , , , , , , , , , , , , , , , , , , , , , , , , , , , , , , , , , , , , , , , , , , , , , , , , , , , , , , , , , , , , , , , , , , , , , , , , , , , , , , , , , , , , , , , , , , , , , , , , , , , , , , , , , , , , , , , , , , , , European Society of Cardiology
      European Heart Journal
      Oxford University Press (OUP)
      Bookmark
          There is no author summary for this article yet. Authors can add summaries to their articles on ScienceOpen to make them more accessible to a non-specialist audience.

          Abstract

          Aims

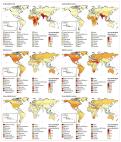
          This report from the European Society of Cardiology (ESC) Atlas Project updates and expands upon the widely cited 2019 report in presenting cardiovascular disease (CVD) statistics for the 57 ESC member countries.

          Methods and results

          Statistics pertaining to 2019, or the latest available year, are presented. Data sources include the World Health Organization, the Institute for Health Metrics and Evaluation, the World Bank, and novel ESC sponsored data on human and capital infrastructure and cardiovascular healthcare delivery. New material in this report includes sociodemographic and environmental determinants of CVD, rheumatic heart disease, out-of-hospital cardiac arrest, left-sided valvular heart disease, the advocacy potential of these CVD statistics, and progress towards World Health Organization (WHO) 2025 targets for non-communicable diseases. Salient observations in this report: (i) Females born in ESC member countries in 2018 are expected to live 80.8 years and males 74.8 years. Life expectancy is longer in high income (81.6 years) compared with middle-income (74.2 years) countries. (ii) In 2018, high-income countries spent, on average, four times more on healthcare than middle-income countries. (iii) The median PM2.5 concentrations in 2019 were over twice as high in middle-income ESC member countries compared with high-income countries and exceeded the EU air quality standard in 14 countries, all middle-income. (iv) In 2016, more than one in five adults across the ESC member countries were obese with similar prevalence in high and low-income countries. The prevalence of obesity has more than doubled over the past 35 years. (v) The burden of CVD falls hardest on middle-income ESC member countries where estimated incidence rates are ∼30% higher compared with high-income countries. This is reflected in disability-adjusted life years due to CVD which are nearly four times as high in middle-income compared with high-income countries. (vi) The incidence of calcific aortic valve disease has increased seven-fold during the last 30 years, with age-standardized rates four times as high in high-income compared with middle-income countries. (vii) Although the total number of CVD deaths across all countries far exceeds the number of cancer deaths for both sexes, there are 15 ESC member countries in which cancer accounts for more deaths than CVD in males and five-member countries in which cancer accounts for more deaths than CVD in females. (viii) The under-resourced status of middle-income countries is associated with a severe procedural deficit compared with high-income countries in terms of coronary intervention, ablation procedures, device implantation, and cardiac surgical procedures.

          Conclusion

          Risk factors and unhealthy behaviours are potentially reversible, and this provides a huge opportunity to address the health inequalities across ESC member countries that are highlighted in this report. It seems clear, however, that efforts to seize this opportunity are falling short and present evidence suggests that most of the WHO NCD targets for 2025 are unlikely to be met across ESC member countries.

          Related collections

          Most cited references288

          • Record: found
          • Abstract: found
          • Article: not found

          Heart Disease and Stroke Statistics—2020 Update

          Circulation
            Bookmark
            • Record: found
            • Abstract: found
            • Article: found
            Is Open Access

            Trends in adult body-mass index in 200 countries from 1975 to 2014: a pooled analysis of 1698 population-based measurement studies with 19·2 million participants

            Summary Background Underweight and severe and morbid obesity are associated with highly elevated risks of adverse health outcomes. We estimated trends in mean body-mass index (BMI), which characterises its population distribution, and in the prevalences of a complete set of BMI categories for adults in all countries. Methods We analysed, with use of a consistent protocol, population-based studies that had measured height and weight in adults aged 18 years and older. We applied a Bayesian hierarchical model to these data to estimate trends from 1975 to 2014 in mean BMI and in the prevalences of BMI categories (<18·5 kg/m2 [underweight], 18·5 kg/m2 to <20 kg/m2, 20 kg/m2 to <25 kg/m2, 25 kg/m2 to <30 kg/m2, 30 kg/m2 to <35 kg/m2, 35 kg/m2 to <40 kg/m2, ≥40 kg/m2 [morbid obesity]), by sex in 200 countries and territories, organised in 21 regions. We calculated the posterior probability of meeting the target of halting by 2025 the rise in obesity at its 2010 levels, if post-2000 trends continue. Findings We used 1698 population-based data sources, with more than 19·2 million adult participants (9·9 million men and 9·3 million women) in 186 of 200 countries for which estimates were made. Global age-standardised mean BMI increased from 21·7 kg/m2 (95% credible interval 21·3–22·1) in 1975 to 24·2 kg/m2 (24·0–24·4) in 2014 in men, and from 22·1 kg/m2 (21·7–22·5) in 1975 to 24·4 kg/m2 (24·2–24·6) in 2014 in women. Regional mean BMIs in 2014 for men ranged from 21·4 kg/m2 in central Africa and south Asia to 29·2 kg/m2 (28·6–29·8) in Polynesia and Micronesia; for women the range was from 21·8 kg/m2 (21·4–22·3) in south Asia to 32·2 kg/m2 (31·5–32·8) in Polynesia and Micronesia. Over these four decades, age-standardised global prevalence of underweight decreased from 13·8% (10·5–17·4) to 8·8% (7·4–10·3) in men and from 14·6% (11·6–17·9) to 9·7% (8·3–11·1) in women. South Asia had the highest prevalence of underweight in 2014, 23·4% (17·8–29·2) in men and 24·0% (18·9–29·3) in women. Age-standardised prevalence of obesity increased from 3·2% (2·4–4·1) in 1975 to 10·8% (9·7–12·0) in 2014 in men, and from 6·4% (5·1–7·8) to 14·9% (13·6–16·1) in women. 2·3% (2·0–2·7) of the world’s men and 5·0% (4·4–5·6) of women were severely obese (ie, have BMI ≥35 kg/m2). Globally, prevalence of morbid obesity was 0·64% (0·46–0·86) in men and 1·6% (1·3–1·9) in women. Interpretation If post-2000 trends continue, the probability of meeting the global obesity target is virtually zero. Rather, if these trends continue, by 2025, global obesity prevalence will reach 18% in men and surpass 21% in women; severe obesity will surpass 6% in men and 9% in women. Nonetheless, underweight remains prevalent in the world’s poorest regions, especially in south Asia. Funding Wellcome Trust, Grand Challenges Canada.
              Bookmark
              • Record: found
              • Abstract: found
              • Article: not found

              Reduction in the incidence of type 2 diabetes with lifestyle intervention or metformin.

              Type 2 diabetes affects approximately 8 percent of adults in the United States. Some risk factors--elevated plasma glucose concentrations in the fasting state and after an oral glucose load, overweight, and a sedentary lifestyle--are potentially reversible. We hypothesized that modifying these factors with a lifestyle-intervention program or the administration of metformin would prevent or delay the development of diabetes. We randomly assigned 3234 nondiabetic persons with elevated fasting and post-load plasma glucose concentrations to placebo, metformin (850 mg twice daily), or a lifestyle-modification program with the goals of at least a 7 percent weight loss and at least 150 minutes of physical activity per week. The mean age of the participants was 51 years, and the mean body-mass index (the weight in kilograms divided by the square of the height in meters) was 34.0; 68 percent were women, and 45 percent were members of minority groups. The average follow-up was 2.8 years. The incidence of diabetes was 11.0, 7.8, and 4.8 cases per 100 person-years in the placebo, metformin, and lifestyle groups, respectively. The lifestyle intervention reduced the incidence by 58 percent (95 percent confidence interval, 48 to 66 percent) and metformin by 31 percent (95 percent confidence interval, 17 to 43 percent), as compared with placebo; the lifestyle intervention was significantly more effective than metformin. To prevent one case of diabetes during a period of three years, 6.9 persons would have to participate in the lifestyle-intervention program, and 13.9 would have to receive metformin. Lifestyle changes and treatment with metformin both reduced the incidence of diabetes in persons at high risk. The lifestyle intervention was more effective than metformin.
                Bookmark

                Author and article information

                Contributors
                (View ORCID Profile)
                (View ORCID Profile)
                (View ORCID Profile)
                (View ORCID Profile)
                (View ORCID Profile)
                (View ORCID Profile)
                (View ORCID Profile)
                (View ORCID Profile)
                (View ORCID Profile)
                (View ORCID Profile)
                (View ORCID Profile)
                Journal
                European Heart Journal
                Oxford University Press (OUP)
                0195-668X
                1522-9645
                February 21 2022
                February 21 2022
                January 08 2022
                February 21 2022
                February 21 2022
                January 08 2022
                : 43
                : 8
                : 716-799
                Article
                10.1093/eurheartj/ehab892
                35016208
                bcea38bc-f68a-490f-9502-74a386e111af
                © 2022

                https://academic.oup.com/journals/pages/open_access/funder_policies/chorus/standard_publication_model

                History

                Comments

                Comment on this article