35
views
0
recommends
+1 Recommend
2 collections
    0
    shares
      • Record: found
      • Abstract: found
      • Article: found
      Is Open Access

      Decline in COVID-19 Hospitalization Growth Rates Associated with Statewide Mask Mandates — 10 States, March–October 2020

      research-article

      Read this article at

      Bookmark
          There is no author summary for this article yet. Authors can add summaries to their articles on ScienceOpen to make them more accessible to a non-specialist audience.

          Abstract

          SARS-CoV-2, the virus that causes coronavirus disease 2019 (COVID-19), is transmitted predominantly by respiratory droplets generated when infected persons cough, sneeze, spit, sing, talk, or breathe. CDC recommends community use of face masks to prevent transmission of SARS-CoV-2 ( 1 ). As of October 22, 2020, statewide mask mandates were in effect in 33 states and the District of Columbia ( 2 ). This study examined whether implementation of statewide mask mandates was associated with COVID-19–associated hospitalization growth rates among different age groups in 10 sites participating in the COVID-19–Associated Hospitalization Surveillance Network (COVID-NET) in states that issued statewide mask mandates during March 1–October 17, 2020. Regression analysis demonstrated that weekly hospitalization growth rates declined by 2.9 percentage points (95% confidence interval [CI] = 0.3–5.5) among adults aged 40–64 years during the first 2 weeks after implementing statewide mask mandates. After mask mandates had been implemented for ≥3 weeks, hospitalization growth rates declined by 5.5 percentage points among persons aged 18–39 years (95% CI = 0.6–10.4) and those aged 40–64 years (95% CI = 0.8–10.2). Statewide mask mandates might be associated with reductions in SARS-CoV-2 transmission and might contribute to reductions in COVID-19 hospitalization growth rates, compared with growth rates during <4 weeks before implementation of the mandate and the implementation week. Mask-wearing is a component of a multipronged strategy to decrease exposure to and transmission of SARS-CoV-2 and reduce strain on the health care system, with likely direct effects on COVID-19 morbidity and associated mortality. Data on statewide mask mandates during March 1–October 22, 2020, were obtained by CDC and the University of Nevada, Las Vegas, from state government websites containing executive or administrative orders, which were analyzed and coded to extract effective dates of statewide mask mandates. A statewide mask mandate was defined as the requirement that persons operating in a personal capacity (i.e., not limited to specific professions or employees) wear a mask 1) anywhere outside their home or 2) in retail businesses and in restaurants or food establishments. All coding and analyses underwent secondary review and quality assurance checks by two or more raters; upon agreement among all raters, coding and analyses were published in a freely available data set ( 2 ). Cumulative COVID-19–associated hospitalization rates for each week during March 1–October 17, 2020, (33 weeks) were obtained from COVID-NET, a population-based surveillance system ( 3 ). COVID-NET provides laboratory-confirmed, COVID-19–associated hospitalization rates (hospitalizations per 100,000 persons) in 99 counties located in 14 states, commencing the week of March 1, 2020* ( 4 ). Certain counties in each state participate in COVID-NET, except Maryland, where all counties participate. A group of counties participating in COVID-NET within a state is termed a site. Sites in states that did not have statewide mask mandates during March 1–October 17, 2020, were excluded from the analyses. For analyses, cumulative hospitalization rates for each week of the study period for seven age cohorts (adults aged 18–29, 30–39, 40–49, 50–64, 65–74, 75–84, and ≥85 years) were aggregated into three age groups (18–39, 40–64, and ≥65 years) † ; sites with a cumulative hospitalization rate of zero per 100,000 persons were imputed to 0.1 per 100,000. Hospitalizations among children and adolescents aged <18 years were not included because few hospitalizations were reported among this age group during the study period. The outcome was the hospitalization growth rate, defined as the weekly percentage change in cumulative COVID-19 hospitalizations per 100,000 persons. The weekly percentage change was calculated as the difference of logarithms in cumulative COVID-19 hospitalization rates by week. § The association between mask mandates and COVID-19–associated hospitalization growth rates was measured using a time-based categorical variable with four mutually exclusive categories based on the week (Sunday through Saturday), with the effective date of the mask mandate (“implementation week”) characterized as follows: ≥4 weeks before the implementation week; <4 weeks before the implementation week (reference); <3 weeks after the implementation week; and ≥3 weeks after the implementation week. ¶ Week zero (implementation week) was defined as the week that included the date the mask mandate went into effect and was included in the reference period. The hospitalization rate ≥4 weeks before implementation of the mask mandate was compared with that during the reference period to test whether sites with mask mandates had differential trends in COVID-19–associated hospitalization rates before issuance of mask mandates This study used a regression model with panel data to compare COVID-19–associated hospitalization growth rates at COVID-NET sites with mandates before and after the dates that statewide mask mandates became effective ( 5 ). Using hospitalization growth rates before mask mandates were implemented (i.e., the reference period: <4 weeks before the implementation week and the implementation week), the model predicted hospitalization growth rates after mask mandates, assuming mandates had not been implemented. Then the model compared the predicted values with the observed hospitalization growth rates after mask mandates were implemented. The study controlled for mask mandates, state, age group, and time (i.e., week of the year).** The study also controlled for statewide closing and reopening as determined by the date of stay-at-home orders and business closures (Supplementary Table, https://stacks.cdc.gov/view/cdc/101127). †† P-values <0.05 were considered statistically significant. Analyses were conducted separately for three age groups (18–39, 40–64, and ≥65 years) and for all adults aged ≥18 years using Stata software (version 16.1; StataCorp). This study was reviewed by CDC and was conducted consistent with applicable federal law and CDC policy. §§ Ten of the 14 COVID-NET participating sites were in states that had issued statewide mask mandates since March 2020 (Table 1). The overall COVID-19–associated hospitalization growth rates among all adults declined 2.4 percentage points (p-value = 0.04) <3 weeks after the implementation week and declined 4.9 percentage points (p-value <0.01) during the period ≥3 weeks after the implementation week (Table 2). The declines were statistically significant. TABLE 1 Effective dates of statewide mask mandates — 10 COVID-19–Associated Hospitalization Surveillance Network sites with statewide mask mandates, March–October 2020 State Effective date of statewide mask mandate Source California Jun 18, 2020 California Health Order (Jun 18, 2020) https://www.countyofnapa.org/DocumentCenter/View/17945/Guidance-for-Face-Coverings_06-18-2020) Colorado Jul 16, 2020 Colorado Executive Order No. D 2020–138 (Jul 16, 2020) https://www.colorado.gov/governor/sites/default/files/inline-files/D%202020%20138%20Mask%20Order.pdf) Connecticut Apr 20, 2020 Connecticut Executive Order No. 7BB (Apr 17, 2020) (https://portal.ct.gov/-/media/Office-of-the-Governor/Executive-Orders/Lamont-Executive-Orders/Executive-Order-No-7BB.pdf) Maryland Apr 18, 2020 Maryland Executive Order No. 20–04–15–01 (Apr 15, 2020) (https://governor.maryland.gov/wp-content/uploads/2020/04/Masks-and-Physical-Distancing-4.15.20.pdf) Michigan* Apr 26, 2020 Michigan Executive Order No. 2020–59 (Apr 24, 2020) (https://content.govdelivery.com/attachments/MIEOG/2020/04/24/file_attachments/1435194/EO%202020-59.pdf) Minnesota Jul 24, 2020 Minnesota Emergency Executive Order 20–81 (Jul 22, 2020) (https://mn.gov/governor/assets/EO%2020-81%20Final%20Filed_tcm1055-441323.pdf) New Mexico Jun 1, 2020 New Mexico Health Order (Jun 1, 2020) (https://cv.nmhealth.org/wp-content/uploads/2020/06/060120-PHO.pdf) New York Apr 17, 2020 New York Executive Order No. 202.17 (Apr 15, 2020) (https://www.governor.ny.gov/news/no-20217-continuing-temporary-suspension-and-modification-laws-relating-disaster-emergency) Ohio Jul 23, 2020 Ohio Health Order (Jul 23, 2020) (https://coronavirus.ohio.gov/static/publicorders/Directors-Order-Facial-Coverings-throughout-State-Ohio.pdf) Oregon Jul 1, 2020 Oregon Health Order (Jun 30, 2020) (https://web.archive.org/web/20200702101516/https://sharedsystems.dhsoha.state.or.us/DHSForms/Served/le2288K.pdf) Abbreviation: COVID-19 = coronavirus disease 2019. * Because of a ruling from Michigan’s supreme court, a 3-day lapse in Michigan’s statewide mask mandate occurred during October 2–4. The analyses did not consider this lapse. All other statewide mask mandates were continuous throughout the study period. TABLE 2 Estimated association between mask mandates and COVID-19–associated hospitalization growth rates in sites with statewide mask mandates, by age group — 10 COVID-19–Associated Hospitalization Surveillance Network sites,* , † March–October 2020 Time relative to week mask mandate was implemented All (≥18 yrs) 18–39 yrs 40–64 yrs ≥65 yrs Percentage point change* (95% CI) p-value Percentage point change* (95% CI) p-value Percentage point change* (95% CI) p-value Percentage point change* (95% CI) p-value ≥4 weeks before −4.3 (−10.5 to 1.9) 0.17 −4.7 (−16.9 to 7.5) 0.43 −4.0 (−13.3 to 5.3) 0.38 −5.3 (−14.9 to 4.3) 0.27 <4 weeks before§ Referent — Referent — Referent — Referent — <3 weeks after −2.4 (−4.7 to −0.1) 0.04 −2.1 (−6.4 to 2.2) 0.31 −2.9 (−5.5 to −0.3) 0.03 −1.1 (−3.9 to 1.6) 0.41 ≥3 weeks after −4.9 (−8.5 to −1.2) <0.01 −5.5 (−10.4 to −0.6) 0.03 −5.5 (−10.2 to −0.8) 0.02 −0.5 (−5.2 to 4.1) 0.83 Abbreviations: CI = confidence interval; COVID-19 = coronavirus disease 2019. * Percentage points are coefficients from the regression models. Reported numbers are from regression models, which controlled for state, age group, time (week), and statewide closing and reopening. † California, Colorado, Connecticut, Maryland, Michigan, Minnesota, New Mexico, New York, Ohio, and Oregon. § This period includes the implementation week (i.e., week zero). Among persons aged 18–39 years, the hospitalization growth rates <3 weeks after the implementation week were lower than were those during the <4 weeks before the implementation week and the implementation week (reference period) when no mask mandate existed, but the estimated percentage point difference (–2.1) was not statistically significant (p-value = 0.31) (Figure) (Table 2). However, in this population, mask mandates were associated with a statistically significant 5.5 percentage-point decline in COVID-19 hospitalization growth rates (p-value = 0.03) ≥3 weeks after the implementation week. Among adults aged 40–64 years, mask mandates were associated with a 2.9 percentage-point reduction in COVID-19 hospitalization growth rates (p-value = 0.03) <3 weeks after the implementation week. Hospitalization growth rates declined by 5.5 percentage points (p-value = 0.02) during ≥3 weeks after the implementation week. Among adults aged ≥65 years, COVID-19 hospitalization growth rates declined <3 weeks after the implementation week (1.1 percentage points) and ≥3 weeks after the implementation week (0.5 percentage points); however, the declines were not statistically significant.
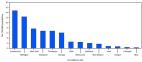
 FIGURE Estimates of association between implementation of statewide mask mandates and laboratory-confirmed COVID-19–associated hospitalization growth rates,* ,†,§ by age group — 10 COVID-19–Associated Hospitalization Surveillance Network sites ¶ with statewide mask mandates, March–October 2020 Abbreviation: COVID-19 = coronavirus disease 2019. * With error bars indicating 95% confidence intervals. † Relative to <4 weeks before implementation week (reference period, which includes the implementation week). § Reported numbers are coefficients from the regression models, which controlled state, age group, time (week), and statewide closing and reopening. ¶ California, Colorado, Connecticut, Maryland, Michigan, Minnesota, New Mexico, New York, Ohio, and Oregon. The figure is a chart that shows estimates of association between implementation of statewide mask mandates and laboratory-confirmed COVID-19–associated hospitalization growth rates, by age group, at 10 COVID-19–Associated Hospitalization Surveillance Network sites with statewide mask mandates during March–October 2020. In the ≥4 weeks before the implementation week, COVID-19–associated hospitalization growth rates were lower than were those <4 weeks before the implementation week and during the implementation week (reference). However, the percentage point differences were not statistically significant. Discussion Masks are intended to reduce emission of virus-laden respiratory droplets, which is especially relevant for persons who are infected with SARS-CoV-2 but are asymptomatic or presymptomatic; masks also help reduce inhalation of respiratory droplets by the wearer ( 1 ). Findings from this study suggest that statewide mask mandates were associated with statistically significant declines in weekly COVID-19 hospitalization growth rates for adults aged 40–64 years <3 weeks after the week that the mandate was implemented, and for adults aged 18–64 years ≥3 weeks after the implementation week. The declines in hospitalization growth rates <3 weeks after the implementation week are consistent with the incubation period of SARS-CoV-2; in a report based on an analysis of publicly reported confirmed COVID-19 cases, the median estimated incubation period was 5.1 days, and most symptomatic patients reported symptoms within 11.5 days after exposure ( 6 ). Therefore, <3 weeks after the implementation of mask mandate would be long enough to identify an association between mask mandates and COVID-19–associated hospitalization growth rates. Previous studies have shown that the various physical distancing measures, including mask mandates, were associated with immediate declines in COVID-19 case growth rates ( 5 , 7 ). This study did not demonstrate a statistically significant decline in COVID-19–associated hospitalization growth rates for adults aged ≥65 years, suggesting that there might have been less of a decline in this age group, compared with that of other adults, although CIs were wide. A study conducted during May 2020 indicated that approximately 70% of U.S. adults aged ≥65 years reported always wearing a mask in public, compared with only 44% of those aged 18–24 years ( 8 ). As a result, statewide mask mandates might have had a lesser impact on the masking behaviors of adults aged ≥65 years, compared with behaviors among other adults because of relatively high baseline level of mask use among this age group during the reference period (i.e., <4 weeks before the implementation week and the implementation week). Declines in hospitalization growth rates during March 1–October 17, 2020, might also have resulted in a substantial decrease in health care costs associated with COVID-19. CDC has determined that COVID-19–related hospital costs per adult hospitalization varied from $8,400 in a general ward to >$50,000 in an intensive care unit with a ventilator ( 9 ). Because COVID-19 can lead to prolonged illness and require long-term treatment ( 10 ), the expected savings associated with the decline in hospitalization rates could be much higher than these reduced hospital costs associated with COVID-19. The findings in this report are subject to at least four limitations. First, the model did not control for other policies that might affect hospitalization growth rates, including school closing and physical distancing recommendations; however, it did control for the dates of statewide closing and reopening, based on statewide stay-at-home orders and business closures. Second, these findings are limited to state-issued statewide mask mandates and do not account for local variability, such as county-level mask mandates. ¶¶ Third, the findings are based on sites participating in COVID-NET and are limited to persons aged ≥18 years and therefore might not be generalizable to the entire U.S. population. Finally, it was assumed that the estimated effect in hospitalization growth rates after mask mandate implementation week did not depend on the issuance dates (e.g., Monday versus Friday), although number of days after the issuance of mask mandates in week zero varied by issuance date. Also, it was assumed that the mask mandates could not affect the hospitalization growth rates during the implementation week. At the individual level, the prevention benefit of using a mask increases as more persons use masks consistently and correctly. Studies have confirmed the benefit of masking for SARS-CoV-2 control; each study demonstrated that, after implementation of directives from organizational or political leadership for universal masking, new infections decreased significantly ( 1 ). This study supports community masking to reduce the transmission of SARS-CoV-2. It also demonstrates that statewide mask mandates were associated with a reduction in COVID-19–associated hospitalization growth rates among adults aged 18–64 years and might affect age groups differently. Mask-wearing is part of a multipronged application of evidence-based strategies that prevent the transmission of SARS-CoV-2; wearing a mask reduces exposure, transmission, and strain on the health care system with likely direct effects on COVID-19 morbidity and associated mortality ( 1 ). Summary What is already known about this topic? Wearing masks is recommended to mitigate the spread of COVID-19. What is added by this report? During March 22–October 17, 2020, 10 sites participating in the COVID-19–Associated Hospitalization Surveillance Network in states with statewide mask mandates reported a decline in weekly COVID-19–associated hospitalization growth rates by up to 5.5 percentage points for adults aged 18–64 years after mandate implementation, compared with growth rates during the 4 weeks preceding implementation of the mandate. What are the implications for public health practice? Mask-wearing is a component of a multipronged strategy to decrease exposure to and transmission of SARS-CoV-2 and reduce strain on the health care system, with likely direct effects on COVID-19 morbidity and associated mortality.

          Related collections

          Most cited references5

          • Record: found
          • Abstract: found
          • Article: not found

          The Incubation Period of Coronavirus Disease 2019 (COVID-19) From Publicly Reported Confirmed Cases: Estimation and Application

          Background: A novel human coronavirus, severe acute respiratory syndrome coronavirus 2 (SARS-CoV-2), was identified in China in December 2019. There is limited support for many of its key epidemiologic features, including the incubation period for clinical disease (coronavirus disease 2019 [COVID-19]), which has important implications for surveillance and control activities. Objective: To estimate the length of the incubation period of COVID-19 and describe its public health implications. Design: Pooled analysis of confirmed COVID-19 cases reported between 4 January 2020 and 24 February 2020. Setting: News reports and press releases from 50 provinces, regions, and countries outside Wuhan, Hubei province, China. Participants: Persons with confirmed SARS-CoV-2 infection outside Hubei province, China. Measurements: Patient demographic characteristics and dates and times of possible exposure, symptom onset, fever onset, and hospitalization. Results: There were 181 confirmed cases with identifiable exposure and symptom onset windows to estimate the incubation period of COVID-19. The median incubation period was estimated to be 5.1 days (95% CI, 4.5 to 5.8 days), and 97.5% of those who develop symptoms will do so within 11.5 days (CI, 8.2 to 15.6 days) of infection. These estimates imply that, under conservative assumptions, 101 out of every 10 000 cases (99th percentile, 482) will develop symptoms after 14 days of active monitoring or quarantine. Limitation: Publicly reported cases may overrepresent severe cases, the incubation period for which may differ from that of mild cases. Conclusion: This work provides additional evidence for a median incubation period for COVID-19 of approximately 5 days, similar to SARS. Our results support current proposals for the length of quarantine or active monitoring of persons potentially exposed to SARS-CoV-2, although longer monitoring periods might be justified in extreme cases. Primary Funding Source: U.S. Centers for Disease Control and Prevention, National Institute of Allergy and Infectious Diseases, National Institute of General Medical Sciences, and Alexander von Humboldt Foundation.
            Bookmark
            • Record: found
            • Abstract: found
            • Article: found
            Is Open Access

            Hospitalization Rates and Characteristics of Patients Hospitalized with Laboratory-Confirmed Coronavirus Disease 2019 — COVID-NET, 14 States, March 1–30, 2020

            Since SARS-CoV-2, the novel coronavirus that causes coronavirus disease 2019 (COVID-19), was first detected in December 2019 ( 1 ), approximately 1.3 million cases have been reported worldwide ( 2 ), including approximately 330,000 in the United States ( 3 ). To conduct population-based surveillance for laboratory-confirmed COVID-19–associated hospitalizations in the United States, the COVID-19–Associated Hospitalization Surveillance Network (COVID-NET) was created using the existing infrastructure of the Influenza Hospitalization Surveillance Network (FluSurv-NET) ( 4 ) and the Respiratory Syncytial Virus Hospitalization Surveillance Network (RSV-NET). This report presents age-stratified COVID-19–associated hospitalization rates for patients admitted during March 1–28, 2020, and clinical data on patients admitted during March 1–30, 2020, the first month of U.S. surveillance. Among 1,482 patients hospitalized with COVID-19, 74.5% were aged ≥50 years, and 54.4% were male. The hospitalization rate among patients identified through COVID-NET during this 4-week period was 4.6 per 100,000 population. Rates were highest (13.8) among adults aged ≥65 years. Among 178 (12%) adult patients with data on underlying conditions as of March 30, 2020, 89.3% had one or more underlying conditions; the most common were hypertension (49.7%), obesity (48.3%), chronic lung disease (34.6%), diabetes mellitus (28.3%), and cardiovascular disease (27.8%). These findings suggest that older adults have elevated rates of COVID-19–associated hospitalization and the majority of persons hospitalized with COVID-19 have underlying medical conditions. These findings underscore the importance of preventive measures (e.g., social distancing, respiratory hygiene, and wearing face coverings in public settings where social distancing measures are difficult to maintain) † to protect older adults and persons with underlying medical conditions, as well as the general public. In addition, older adults and persons with serious underlying medical conditions should avoid contact with persons who are ill and immediately contact their health care provider(s) if they have symptoms consistent with COVID-19 (https://www.cdc.gov/coronavirus/2019-ncov/symptoms-testing/symptoms.html) ( 5 ). Ongoing monitoring of hospitalization rates, clinical characteristics, and outcomes of hospitalized patients will be important to better understand the evolving epidemiology of COVID-19 in the United States and the clinical spectrum of disease, and to help guide planning and prioritization of health care system resources. COVID-NET conducts population-based surveillance for laboratory-confirmed COVID-19–associated hospitalizations among persons of all ages in 99 counties in 14 states (California, Colorado, Connecticut, Georgia, Iowa, Maryland, Michigan, Minnesota, New Mexico, New York, Ohio, Oregon, Tennessee, and Utah), distributed across all 10 U.S Department of Health and Human Services regions. § The catchment area represents approximately 10% of the U.S. population. Patients must be residents of a designated COVID-NET catchment area and hospitalized within 14 days of a positive SARS-CoV-2 test to meet the surveillance case definition. Testing is requested at the discretion of treating health care providers. Laboratory-confirmed SARS-CoV-2 is defined as a positive result by any test that has received Emergency Use Authorization for SARS-CoV-2 testing. ¶ COVID-NET surveillance officers in each state identify cases through active review of notifiable disease and laboratory databases and hospital admission and infection control practitioner logs. Weekly age-stratified hospitalization rates are estimated using the number of catchment area residents hospitalized with laboratory-confirmed COVID-19 as the numerator and National Center for Health Statistics vintage 2018 bridged-race postcensal population estimates for the denominator.** As of April 3, 2020, COVID-NET hospitalization rates are being published each week at https://gis.cdc.gov/grasp/covidnet/COVID19_3.html. For each case, trained surveillance officers conduct medical chart abstractions using a standard case report form to collect data on patient characteristics, underlying medical conditions, clinical course, and outcomes. Chart reviews are finalized once patients have a discharge disposition. COVID-NET surveillance was initiated on March 23, 2020, with retrospective case identification of patients admitted during March 1–22, 2020, and prospective case identification during March 23–30, 2020. Clinical data on underlying conditions and symptoms at admission are presented through March 30; hospitalization rates are updated weekly and, therefore, are presented through March 28 (epidemiologic week 13). The COVID-19–associated hospitalization rate among patients identified through COVID-NET for the 4-week period ending March 28, 2020, was 4.6 per 100,000 population (Figure 1). Hospitalization rates increased with age, with a rate of 0.3 in persons aged 0–4 years, 0.1 in those aged 5–17 years, 2.5 in those aged 18–49 years, 7.4 in those aged 50–64 years, and 13.8 in those aged ≥65 years. Rates were highest among persons aged ≥65 years, ranging from 12.2 in those aged 65–74 years to 17.2 in those aged ≥85 years. More than half (805; 54.4%) of hospitalizations occurred among men; COVID-19-associated hospitalization rates were higher among males than among females (5.1 versus 4.1 per 100,000 population). Among the 1,482 laboratory-confirmed COVID-19–associated hospitalizations reported through COVID-NET, six (0.4%) each were patients aged 0–4 years and 5–17 years, 366 (24.7%) were aged 18–49 years, 461 (31.1%) were aged 50–64 years, and 643 (43.4%) were aged ≥65 years. Among patients with race/ethnicity data (580), 261 (45.0%) were non-Hispanic white (white), 192 (33.1%) were non-Hispanic black (black), 47 (8.1%) were Hispanic, 32 (5.5%) were Asian, two (0.3%) were American Indian/Alaskan Native, and 46 (7.9%) were of other or unknown race. Rates varied widely by COVID-NET surveillance site (Figure 2). FIGURE 1 Laboratory-confirmed coronavirus disease 2019 (COVID-19)–associated hospitalization rates,* by age group — COVID-NET, 14 states, † March 1–28, 2020 Abbreviation: COVID-NET = Coronavirus Disease 2019–Associated Hospitalization Surveillance Network. * Number of patients hospitalized with COVID-19 per 100,000 population. † Counties included in COVID-NET surveillance: California (Alameda, Contra Costa, and San Francisco counties); Colorado (Adams, Arapahoe, Denver, Douglas, and Jefferson counties); Connecticut (New Haven and Middlesex counties); Georgia (Clayton, Cobb, DeKalb, Douglas, Fulton, Gwinnett, Newton, and Rockdale counties); Iowa (one county represented); Maryland (Allegany, Anne Arundel, Baltimore, Baltimore City, Calvert, Caroline, Carroll, Cecil, Charles, Dorchester, Frederick, Garrett, Harford, Howard, Kent, Montgomery, Prince George’s, Queen Anne’s, St. Mary’s, Somerset, Talbot, Washington, Wicomico, and Worcester counties); Michigan (Clinton, Eaton, Genesee, Ingham, and Washtenaw counties); Minnesota (Anoka, Carver, Dakota, Hennepin, Ramsey, Scott, and Washington counties); New Mexico (Bernalillo, Chaves, Dona Ana, Grant, Luna, San Juan, and Santa Fe counties); New York (Albany, Columbia, Genesee, Greene, Livingston, Monroe, Montgomery, Ontario, Orleans, Rensselaer, Saratoga, Schenectady, Schoharie, Wayne, and Yates counties); Ohio (Delaware, Fairfield, Franklin, Hocking, Licking, Madison, Morrow, Perry, Pickaway and Union counties); Oregon (Clackamas, Multnomah, and Washington counties); Tennessee (Cheatham, Davidson, Dickson, Robertson, Rutherford, Sumner, Williamson, and Wilson counties); and Utah (Salt Lake County). The figure is a bar chart showing laboratory-confirmed COVID-19–associated hospitalization rates, by age group, in 14 states during March 1–28, 2020 according to the Coronavirus Disease 2019–Associated Hospitalization Surveillance Network. FIGURE 2 Laboratory-confirmed coronavirus disease 2019 (COVID-19)–associated hospitalization rates,* by surveillance site † — COVID-NET, 14 states, March 1–28, 2020 Abbreviation: COVID-NET = Coronavirus Disease 2019–Associated Hospitalization Surveillance Network. * Number of patients hospitalized with COVID-19 per 100,000 population. † Counties included in COVID-NET surveillance: California (Alameda, Contra Costa, and San Francisco counties); Colorado (Adams, Arapahoe, Denver, Douglas, and Jefferson counties); Connecticut (New Haven and Middlesex counties); Georgia (Clayton, Cobb, DeKalb, Douglas, Fulton, Gwinnett, Newton, and Rockdale counties); Iowa (one county represented); Maryland (Allegany, Anne Arundel, Baltimore, Baltimore City, Calvert, Caroline, Carroll, Cecil, Charles, Dorchester, Frederick, Garrett, Harford, Howard, Kent, Montgomery, Prince George’s, Queen Anne’s, St. Mary’s, Somerset, Talbot, Washington, Wicomico, and Worcester counties); Michigan (Clinton, Eaton, Genesee, Ingham, and Washtenaw counties); Minnesota (Anoka, Carver, Dakota, Hennepin, Ramsey, Scott, and Washington counties); New Mexico (Bernalillo, Chaves, Dona Ana, Grant, Luna, San Juan, and Santa Fe counties); New York (Albany, Columbia, Genesee, Greene, Livingston, Monroe, Montgomery, Ontario, Orleans, Rensselaer, Saratoga, Schenectady, Schoharie, Wayne, and Yates counties); Ohio (Delaware, Fairfield, Franklin, Hocking, Licking, Madison, Morrow, Perry, Pickaway and Union counties); Oregon (Clackamas, Multnomah, and Washington counties); Tennessee (Cheatham, Davidson, Dickson, Robertson, Rutherford, Sumner, Williamson, and Wilson counties); and Utah (Salt Lake County). The figure is a bar chart showing laboratory-confirmed COVID-19–associated hospitalization rates, by surveillance site, in 14 states during March 1–28, 2020 according to the Coronavirus Disease 2019–Associated Hospitalization Surveillance Network. During March 1–30, underlying medical conditions and symptoms at admission were reported through COVID-NET for approximately 180 (12.1%) hospitalized adults (Table); 89.3% had one or more underlying conditions. The most commonly reported were hypertension (49.7%), obesity (48.3%), chronic lung disease (34.6%), diabetes mellitus (28.3%), and cardiovascular disease (27.8%). Among patients aged 18–49 years, obesity was the most prevalent underlying condition, followed by chronic lung disease (primarily asthma) and diabetes mellitus. Among patients aged 50–64 years, obesity was most prevalent, followed by hypertension and diabetes mellitus; and among those aged ≥65 years, hypertension was most prevalent, followed by cardiovascular disease and diabetes mellitus. Among 33 females aged 15–49 years hospitalized with COVID-19, three (9.1%) were pregnant. Among 167 patients with available data, the median interval from symptom onset to admission was 7 days (interquartile range [IQR] = 3–9 days). The most common signs and symptoms at admission included cough (86.1%), fever or chills (85.0%), and shortness of breath (80.0%). Gastrointestinal symptoms were also common; 26.7% had diarrhea, and 24.4% had nausea or vomiting. TABLE Underlying conditions and symptoms among adults aged ≥18 years with coronavirus disease 2019 (COVID-19)–associated hospitalizations — COVID-NET, 14 states,* March 1–30, 2020† Underlying condition Age group (yrs), no./total no. (%) Overall 18–49 50–64 ≥65 years Any underlying condition 159/178 (89.3) 41/48 (85.4) 51/59 (86.4) 67/71 (94.4) Hypertension 79/159 (49.7) 7/40 (17.5) 27/57 (47.4) 45/62 (72.6) Obesity§ 73/151 (48.3) 23/39 (59.0) 25/51 (49.0) 25/61 (41.0) Chronic metabolic disease¶ 60/166 (36.1) 10/46 (21.7) 21/56 (37.5) 29/64 (45.3)    Diabetes mellitus 47/166 (28.3) 9/46 (19.6) 18/56 (32.1) 20/64 (31.3) Chronic lung disease 55/159 (34.6) 16/44 (36.4) 15/53 (28.3) 24/62 (38.7)    Asthma 27/159 (17.0) 12/44 (27.3) 7/53 (13.2) 8/62 (12.9)    Chronic obstructive pulmonary disease 17/159 (10.7) 0/44 (0.0) 3/53 (5.7) 14/62 (22.6) Cardiovascular disease** 45/162 (27.8) 2/43 (4.7) 11/56 (19.6) 32/63 (50.8)    Coronary artery disease 23/162 (14.2) 0/43 (0.0) 7/56 (12.5) 16/63 (25.4)    Congestive heart failure 11/162 (6.8) 2/43 (4.7) 3/56 (5.4) 6/63 (9.5) Neurologic disease 22/157 (14.0) 4/42 (9.5) 4/55 (7.3) 14/60 (23.3) Renal disease 20/153 (13.1) 3/41 (7.3) 2/53 (3.8) 15/59 (25.4) Immunosuppressive condition 15/156 (9.6) 5/43 (11.6) 4/54 (7.4) 6/59 (10.2) Gastrointestinal/Liver disease 10/152 (6.6) 4/42 (9.5) 0/54 (0.0) 6/56 (10.7) Blood disorder 9/156 (5.8) 1/43 (2.3) 1/55 (1.8) 7/58 (12.1) Rheumatologic/Autoimmune disease 3/154 (1.9) 1/42 (2.4) 0/54 (0.0) 2/58 (3.4) Pregnancy†† 3/33 (9.1) 3/33 (9.1) N/A N/A Symptom §§ Cough 155/180 (86.1) 43/47 (91.5) 54/60 (90.0) 58/73 (79.5) Fever/Chills 153/180 (85.0) 38/47 (80.9) 53/60 (88.3) 62/73 (84.9) Shortness of breath 144/180 (80.0) 40/47 (85.1) 50/60 (83.3) 54/73 (74.0) Myalgia 62/180 (34.4) 20/47 (42.6) 23/60 (38.3) 19/73 (26.0) Diarrhea 48/180 (26.7) 10/47 (21.3) 17/60 (28.3) 21/73 (28.8) Nausea/Vomiting 44/180 (24.4) 12/47 (25.5) 17/60 (28.3) 15/73 (20.5) Sore throat 32/180 (17.8) 8/47 (17.0) 13/60 (21.7) 11/73 (15.1) Headache 29/180 (16.1) 10/47 (21.3) 12/60 (20.0) 7/73 (9.6) Nasal congestion/Rhinorrhea 29/180 (16.1) 8/47 (17.0) 13/60 (21.7) 8/73 (11.0) Chest pain 27/180 (15.0) 9/47 (19.1) 13/60 (21.7) 5/73 (6.8) Abdominal pain 15/180 (8.3) 6/47 (12.8) 6/60 (10.0) 3/73 (4.1) Wheezing 12/180 (6.7) 3/47 (6.4) 2/60 (3.3) 7/73 (9.6) Altered mental status/Confusion 11/180 (6.1) 3/47 (6.4) 2/60 (3.3) 6/73 (8.2) Abbreviations: COVID-NET = Coronavirus Disease 2019–Associated Hospitalization Surveillance Network; N/A = not applicable. * Counties included in COVID-NET surveillance: California (Alameda, Contra Costa, and San Francisco counties); Colorado (Adams, Arapahoe, Denver, Douglas, and Jefferson counties); Connecticut (New Haven and Middlesex counties); Georgia (Clayton, Cobb, DeKalb, Douglas, Fulton, Gwinnett, Newton, and Rockdale counties); Iowa (one county represented); Maryland (Allegany, Anne Arundel, Baltimore, Baltimore City, Calvert, Caroline, Carroll, Cecil, Charles, Dorchester, Frederick, Garrett, Harford, Howard, Kent, Montgomery, Prince George’s, Queen Anne’s, St. Mary’s, Somerset, Talbot, Washington, Wicomico, and Worcester counties); Michigan (Clinton, Eaton, Genesee, Ingham, and Washtenaw counties); Minnesota (Anoka, Carver, Dakota, Hennepin, Ramsey, Scott, and Washington counties); New Mexico (Bernalillo, Chaves, Dona Ana, Grant, Luna, San Juan, and Santa Fe counties); New York (Albany, Columbia, Genesee, Greene, Livingston, Monroe, Montgomery, Ontario, Orleans, Rensselaer, Saratoga, Schenectady, Schoharie, Wayne, and Yates counties); Ohio (Delaware, Fairfield, Franklin, Hocking, Licking, Madison, Morrow, Perry, Pickaway and Union counties); Oregon (Clackamas, Multnomah, and Washington counties); Tennessee (Cheatham, Davidson, Dickson, Robertson, Rutherford, Sumner, Williamson, and Wilson counties); and Utah (Salt Lake County). † COVID-NET included data for one child aged 5–17 years with underlying medical conditions and symptoms at admission; data for this child are not included in this table. This child was reported to have chronic lung disease (asthma). Symptoms included fever, cough, gastrointestinal symptoms, shortness of breath, chest pain, and a sore throat on admission. § Obesity is defined as calculated body mass index (BMI) ≥30 kg/m2, and if BMI is missing, by International Classification of Diseases discharge diagnosis codes. Among 73 patients with obesity, 51 (69.9%) had obesity defined as BMI 30–<40 kg/m2, and 22 (30.1%) had severe obesity defined as BMI ≥40 kg/m2. ¶ Among the 60 patients with chronic metabolic disease, 45 had diabetes mellitus only, 13 had thyroid dysfunction only, and two had diabetes mellitus and thyroid dysfunction. ** Cardiovascular disease excludes hypertension. †† Restricted to women aged 15–49 years. §§ Symptoms were collected through review of admission history and physical exam notes in the medical record and might be determined by subjective or objective findings. In addition to the symptoms in the table, the following less commonly reported symptoms were also noted for adults with information on symptoms (180): hemoptysis/bloody sputum (2.2%), rash (1.1%), conjunctivitis (0.6%), and seizure (0.6%). Discussion During March 1–28, 2020, the overall laboratory-confirmed COVID-19–associated hospitalization rate was 4.6 per 100,000 population; rates increased with age, with the highest rates among adults aged ≥65 years. Approximately 90% of hospitalized patients identified through COVID-NET had one or more underlying conditions, the most common being obesity, hypertension, chronic lung disease, diabetes mellitus, and cardiovascular disease. Using the existing infrastructure of two respiratory virus surveillance platforms, COVID-NET was implemented to produce robust, weekly, age-stratified hospitalization rates using standardized data collection methods. These data are being used, along with data from other surveillance platforms (https://www.cdc.gov/coronavirus/2019-ncov/covid-data/covidview.html), to monitor COVID-19 disease activity and severity in the United States. During the first month of surveillance, COVID-NET hospitalization rates ranged from 0.1 per 100,000 population in persons aged 5–17 years to 17.2 per 100,000 population in adults aged ≥85 years, whereas cumulative influenza hospitalization rates during the first 4 weeks of each influenza season (epidemiologic weeks 40–43) over the past 5 seasons have ranged from 0.1 in persons aged 5–17 years to 2.2–5.4 in adults aged ≥85 years ( 6 ). COVID-NET rates during this first 4-week period of surveillance are preliminary and should be interpreted with caution; given the rapidly evolving nature of the COVID-19 pandemic, rates are expected to increase as additional cases are identified and as SARS-CoV-2 testing capacity in the United States increases. In the COVID-NET catchment population, approximately 49% of residents are male and 51% of residents are female, whereas 54% of COVID-19-associated hospitalizations occurred in males and 46% occurred in females. These data suggest that males may be disproportionately affected by COVID-19 compared with females. Similarly, in the COVID-NET catchment population, approximately 59% of residents are white, 18% are black, and 14% are Hispanic; however, among 580 hospitalized COVID-19 patients with race/ethnicity data, approximately 45% were white, 33% were black, and 8% were Hispanic, suggesting that black populations might be disproportionately affected by COVID-19. These findings, including the potential impact of both sex and race on COVID-19-associated hospitalization rates, need to be confirmed with additional data. Most of the hospitalized patients had underlying conditions, some of which are recognized to be associated with severe COVID-19 disease, including chronic lung disease, cardiovascular disease, diabetes mellitus ( 5 ). COVID-NET does not collect data on nonhospitalized patients; thus, it was not possible to compare the prevalence of underlying conditions in hospitalized versus nonhospitalized patients. Many of the documented underlying conditions among hospitalized COVID-19 patients are highly prevalent in the United States. According to data from the National Health and Nutrition Examination Survey, hypertension prevalence among U.S. adults is 29% overall, ranging from 7.5%–63% across age groups ( 7 ), and age-adjusted obesity prevalence is 42% (range across age groups = 40%–43%) ( 8 ). Among hospitalized COVID-19 patients, hypertension prevalence was 50% (range across age groups = 18%–73%), and obesity prevalence was 48% (range across age groups = 41%–59%). In addition, the prevalences of several underlying conditions identified through COVID-NET were similar to those for hospitalized influenza patients identified through FluSurv-NET during influenza seasons 2014–15 through 2018–19: 41%–51% of patients had cardiovascular disease (excluding hypertension), 39%–45% had chronic metabolic disease, 33%–40% had obesity, and 29%–31% had chronic lung disease ( 6 ). Data on hypertension are not collected by FluSurv-NET. Among women aged 15–49 years hospitalized with COVID-19 and identified through COVID-NET, 9% were pregnant, which is similar to an estimated 9.9% of the general population of women aged 15–44 years who are pregnant at any given time based on 2010 data. †† Similar to other reports from the United States ( 9 ) and China ( 1 ), these findings indicate that a high proportion of U.S. patients hospitalized with COVID-19 are older and have underlying medical conditions. The findings in this report are subject to at least three limitations. First, hospitalization rates by age and COVID-NET site are preliminary and might change as additional cases are identified from this surveillance period. Second, whereas minimum case data to produce weekly age-stratified hospitalization rates are usually available within 7 days of case identification, availability of detailed clinical data are delayed because of the need for medical chart abstractions. As of March 30, chart abstractions had been conducted for approximately 200 COVID-19 patients; the frequency and distribution of underlying conditions during this time might change as additional data become available. Clinical course and outcomes will be presented once the number of cases with complete medical chart abstractions are sufficient; many patients are still hospitalized at the time of this report. Finally, testing for SARS-CoV-2 among patients identified through COVID-NET is performed at the discretion of treating health care providers, and testing practices and capabilities might vary widely across providers and facilities. As a result, underascertainment of cases in COVID-NET is likely. Additional data on testing practices related to SARS-CoV-2 will be collected in the future to account for underascertainment using described methods ( 10 ). Early data from COVID-NET suggest that COVID-19–associated hospitalizations in the United States are highest among older adults, and nearly 90% of persons hospitalized have one or more underlying medical conditions. These findings underscore the importance of preventive measures (e.g., social distancing, respiratory hygiene, and wearing face coverings in public settings where social distancing measures are difficult to maintain) to protect older adults and persons with underlying medical conditions. Ongoing monitoring of hospitalization rates, clinical characteristics, and outcomes of hospitalized patients will be important to better understand the evolving epidemiology of COVID-19 in the United States and the clinical spectrum of disease, and to help guide planning and prioritization of health care system resources. Summary What is already known about this topic? Population-based rates of laboratory-confirmed coronavirus disease 2019 (COVID-19)–associated hospitalizations are lacking in the United States. What is added by this report? COVID-NET was implemented to produce robust, weekly, age-stratified COVID-19–associated hospitalization rates. Hospitalization rates increase with age and are highest among older adults; the majority of hospitalized patients have underlying conditions. What are the implications for public health practice? Strategies to prevent COVID-19, including social distancing, respiratory hygiene, and face coverings in public settings where social distancing measures are difficult to maintain, are particularly important to protect older adults and those with underlying conditions. Ongoing monitoring of hospitalization rates is critical to understanding the evolving epidemiology of COVID-19 in the United States and to guide planning and prioritization of health care resources.
              Bookmark
              • Record: found
              • Abstract: found
              • Article: not found

              Strong Social Distancing Measures In The United States Reduced The COVID-19 Growth Rate: Study evaluates the impact of social distancing measures on the growth rate of confirmed COVID-19 cases across the United States.

              State and local governments imposed social distancing measures in March and April 2020 to contain the spread of the novel coronavirus disease (COVID-19). These measures included bans on large social gatherings; school closures; closures of entertainment venues, gyms, bars, and restaurant dining areas; and shelter-in-place orders. We evaluated the impact of these measures on the growth rate of confirmed COVID-19 cases across US counties between March 1, 2020, and April 27, 2020. An event study design allowed each policy's impact on COVID-19 case growth to evolve over time. Adoption of government-imposed social distancing measures reduced the daily growth rate of confirmed COVID-19 cases by 5.4 percentage points after one to five days, 6.8 percentage points after six to ten days, 8.2 percentage points after eleven to fifteen days, and 9.1 percentage points after sixteen to twenty days. Holding the amount of voluntary social distancing constant, these results imply that there would have been ten times greater spread of COVID-19 by April 27 without shelter-in-place orders (ten million cases) and more than thirty-five times greater spread without any of the four measures (thirty-five million cases). Our article illustrates the potential danger of exponential spread in the absence of interventions, providing information relevant to strategies for restarting economic activity.
                Bookmark

                Author and article information

                Journal
                MMWR Morb Mortal Wkly Rep
                MMWR Morb Mortal Wkly Rep
                WR
                Morbidity and Mortality Weekly Report
                Centers for Disease Control and Prevention
                0149-2195
                1545-861X
                12 February 2021
                12 February 2021
                : 70
                : 6
                : 212-216
                Affiliations
                CDC COVID-19 Response Team; University of Nevada, Las Vegas.
                Author notes
                Corresponding author: Heesoo Joo, hjoo@ 123456cdc.gov .
                Article
                mm7006e2
                10.15585/mmwr.mm7006e2
                7877582
                33571176
                b064a67f-a039-4fba-9d0a-d928244ec314

                All material in the MMWR Series is in the public domain and may be used and reprinted without permission; citation as to source, however, is appreciated.

                History
                Categories
                Full Report

                Comments

                Comment on this article