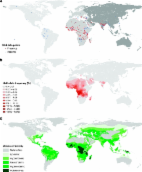
It has been a century since the first description of abnormally elongated red blood cells in an anaemic patient and the link with the clinical symptoms of what is now called sickle cell anaemia (SCA) was published1. Sickle haemoglobin (HbS), a structural variant of normal adult haemoglobin, results from a single amino acid substitution at position 6 of the beta globin molecule (β 6Glu→Val)2. When HbS is inherited from only one parent, the heterozygous child is usually an asymptomatic carrier2. When inherited from both parents, the homozygous child suffers from SCA. HbS is the most common pathological haemoglobin variant worldwide3. Without treatment, which is rarely available in low-income, high-burden countries4, the vast majority of children born with SCA die before the age of 5 years3. Natural selection should therefore have purged this mutation from human populations, but allele frequencies of HbS in excess of 15% have been observed5. In 1949, it was suggested that the Darwinian paradox of high frequencies of genetic blood disorders could result from a selective advantage conferred by such disorders in protecting against Plasmodium falciparum malaria infection in heterozygotes6. This balancing selection, commonly referred to as the 'malaria hypothesis', was originally suggested to explain the geographical correspondence between the distribution of thalassaemia and malaria in the Mediterranean region, and was later confirmed7 in many locations including Sardinia8, Melanesia9 10 and Kenya11. At the same time, a similar relationship between HbS and malaria was independently discovered in Africa12 13. In vitro and in vivo studies have since added support for the protective role of HbS against malaria14 15. Despite significant bibliographic assemblies of information on the distribution of HbS5 16, important limitations exist with previous mapping efforts17 18 19. These include (i) the inclusion of non-random population samples (such as those including patients with malaria or samples from related individuals) that could bias HbS allele frequency estimates; (ii) poor discrimination between indigenous and recently migrated populations that could confound evidence of the relationship between HbS allele frequency and historical malaria endemicity; (iii) the lack of inclusion of HbS allele frequency local geographical heterogeneities; and (iv) limited documentation on the cartographic methodology used to generate maps, making them difficult to reproduce and evaluate objectively. More importantly, the geographical support for the malaria hypothesis has never advanced beyond visual comparison20 21 22 23 24. In this study, we conduct a formal investigation of the geographical evidence in support of the malaria hypothesis at the global scale. In brief, we first updated previous data collections5 16 with online searches of the published literature, which we augmented using unpublished data from the Malaria Genomic Epidemiology Network Consortium (MalariaGEN, http://www.malariagen.net)25, to create a comprehensive geodatabase of HbS allele frequency. These were reviewed using criteria devised to exclude sources of bias, such as those resulting from the inclusion of data from non-representative or non-indigenous populations. We then mapped these data using a Bayesian model-based geostatistical framework26 27 28. This enabled a comparison, for each pixel, between the modelled HbS allele frequency and the endemicity of malaria based on a unique categorical map reflecting its distribution before the era of interventions for malaria control29. Finally, a geostatistical test for geographical association was devised, by computing the areal mean HbS allele frequency associated with each historical malaria endemicity class and calculating the probability that these mean values increased in each successive class. Results HbS allele frequency database and map Searches of the literature identified 41,445 references (see Methods), 90% of which did not include data allowing allele frequency calculations. The application of additional inclusion criteria further restricted the total to 278 informative references (see Supplementary References 64–342, cited in alphabetical order by surname), which have been used as inputs to our model. A total of 699 spatially unique data points were abstracted from these sources and entered into our georeferenced database with 74 additional surveys from MalariaGEN. Of these, 29 (4%) were located in the Americas, 618 (80%) in Africa and Europe (mostly subSaharan Africa) and 126 (16%) in Asia (Fig. 1a and Supplementary Fig. S1). Using our model (see Methods), we produced a continuous 10×10 km resolution global raster grid of HbS allele frequency, with predictions drawn from the median of the posterior predictive distribution for each pixel (Fig. 1b), accompanied by a per-pixel estimate of prediction uncertainty (Fig. 2). Empirical model performance was judged by comparing observed HbS allele frequencies with predicted values for a randomly removed subset of 10% of the data points, which revealed a mean error and a mean absolute error in HbS allele frequency predictions of −0.15 and 6.76%, respectively (see Methods). This global map of HbS allele frequencies should not be interpreted as showing the contemporary geographical distribution of this gene. It is the first global map of the distribution of the HbS gene, based on representative and indigenous population samples (see Methods). Our HbS map (Fig. 1b) showed an HbS allele frequency of >0.5% to be present throughout most of the African continent, the Middle East and India and in localized areas in Mediterranean countries. The maximum predicted value of HbS allele frequency was 18.18% in northern Angola. A large contiguous area with frequencies above 9% was observed stretching from southern Ghana to northern Zambia. The map also indicated similar frequencies in an area extending from southern Senegal to northern Liberia, in localized patches in eastern Côte d'Ivoire, the eastern shores of Lake Victoria, southeast Tanzania and oases on the east coast of Saudi Arabia, as well as in the southern Chhattisgarh and southern Karnataka regions of India. Areas with frequencies above 6% were predicted in Madagascar, central Sudan, the west coast of Saudi Arabia, southeastern Turkey and in the Chalkidiki region of Greece. The many records of absence (Fig. 1a) and the very low HbS allele frequencies predicted by our model (Fig. 1b) also confirmed that HbS was largely absent from the Horn of Africa and from areas south of the Zambezi. Spatial validation of the malaria hypothesis To test the geographical association between HbS and malaria, we used the only available global map of preintervention malaria transmission intensity (endemicity; see Methods)29. On the basis of an assembly of historical malariometric information, this map categorized the world circa 1900 into six classes of successively higher endemicity: malaria free, epidemic, hypoendemic, mesoendemic, hyperendemic and holoendemic (see Fig. 1c for endemicity class definitions)29 30. The relationship between the predicted HbS allele frequencies and the level of malaria endemicity was summarized graphically in violin plots (Fig. 3), which illustrate the density distributions of predicted HbS allele frequencies within each endemic area. HbS was absent from epidemic areas, which were found only in northern America and Eurasia. Globally, predicted HbS allele frequencies were similar in malaria-free, hypoendemic and mesoendemic zones, but were substantially higher in hyperendemic and holoendemic areas (Fig. 3a). In Africa and Europe (Fig. 3b), an increase in HbS allele frequencies from hypoendemic through to holoendemic malaria zones was more pronounced. In Asia (Fig. 3c), no relation between predicted HbS allele frequencies and malaria endemicity was found. HbS was absent in the indigenous populations of the Americas. Although the maps and violin plots provided a valuable insight into the covariation of HbS allele frequency and malaria endemicity, our aim was to formally quantify the significance of any such relationship. Measurement of the difference between the areal mean HbS allele frequency calculated within each endemicity area allowed us to quantify the statistical strength of such differences, taking into account the inherent uncertainty of the predicted HbS allele frequencies (see Methods). Differences in areal means between endemicity regions were calculated for 100 unique realizations of the HbS allele frequency map generated by the Bayesian model (Fig. 4 and Supplementary Fig. S2). When combined, these realizations produced predictive probability distributions for the difference in areal mean HbS allele frequency between each successive endemicity class (see Table 1 and Methods). These geostatistical measures provide the first quantitative evidence for a geographical link between the global distribution of HbS and malaria endemicity. At the global level, we found clear differences between high endemicity classes (Fig. 4a), associated with a high probability of HbS allele frequency increases (>90%) from mesoendemic to hyperendemic and hyperendemic to holoendemic areas, as well as from epidemic to hypoendemic areas (Table 1). In Africa, we observed a gradual increase from epidemic to holoendemic (Fig. 4b). High probabilities of increase were found between the same classes as in the global analysis, but also from hypoendemic to mesoendemic areas (87%). In Asia, differences between classes were much smaller (Fig. 4c) and the probabilities of increase were much lower between most classes, especially in areas of high endemicity. Discussion A strong geographical link between the highest HbS allele frequencies and high malaria endemicity was observed at the global scale (Fig. 4a), but this observation is influenced primarily by the relationship found in Africa (Fig. 4b). The gradual increase in HbS allele frequencies from epidemic areas to holoendemic areas in Africa is consistent with the hypothesis that malaria protection by HbS involves the enhancement of not only innate but also acquired immunity to P. falciparum 31. Interactions with haemoglobin C32 33 might explain the lower HbS allele frequencies in West Africa24. Despite the presence of large malarious areas, HbS is absent in the Americas and in large parts of Asia2 (Fig. 1a). Therefore, no geographical confirmation of the malaria hypothesis could be identified in these regions. Although several haemoglobin variants have been identified in the Americas5, none of the malaria protective polymorphisms have been observed in the indigenous populations of this continent19. The combination of the low likelihood of an independent HbS mutation arising and a relatively low selection pressure (due to the absence of holoendemic areas, the more recent arrival of malaria, as well as the predominance of P. vivax) could contribute to the absence of HbS in that region. In Southeast Asia34, other malaria protective polymorphisms have been identified (haemoglobin E (HbE), the thalassaemias, glucose-6-phosphate dehydrogenase deficiency and Southeast Asian ovalocytosis) and levels of malaria endemicity were relatively high. It is suspected that HbE and Southeast Asian ovalocytosis in particular may have had epistatic interactions35 36, altering the selection pressure for the HbS gene in that region37. The complex social structure and the predominance of P. vivax 38 are also considered as likely to contribute to the unresolved geographical relationship in India. Ongoing work to create an open-access database for several malaria protective polymorphisms will allow more comprehensive distribution mapping and improve our understanding of their geographical interaction. Substantial variations in HbS allele frequencies over short distances (up to 10% over <50 km) have been described in literature5, for example, in relation to altitude, rainfall or Anopheles survival39, which underlie variations in selection40. Such spatial heterogeneity was observed in the geodatabase. The combination of a detailed georeferencing process, the use of a geostatistical model able to incorporate the multiple scales of variation within the data and a semicontinuous gradient of HbS allele frequencies allowed us to describe the global distribution and the high geographical variability of this gene more rigorously than achieved in previous maps17 18 19. The uncertainty measure (see Fig. 2) provides an important estimate of the limitations associated with a retrospective data set, and can highlight areas prone to small population samples and/or areas lacking observations (for example, New Zealand). Among the factors that might contribute to the heterogeneity observed in the HbS allele frequency in hyperendemic areas in Africa (Fig. 3b), we identified (i) a component of geographical sampling error from an 'opportunistic sample' of surveys that we were able to source from literature; (ii) the kinetics of the spread of the HbS gene, which leads to an exponential increase in areas in which a selective pressure appears, but to a much slower decrease in areas in which the selective pressure disappears41; (iii) long-term (sociological or physical) isolation of local populations, which could result in pockets of lower HbS allele frequencies observed on the map (Fig. 1b). One hundred years after the first description of SCA, we used a comprehensive search combined with a rigorous selection of survey data and modern mapping methods to create a new, evidence-based map of the worldwide distribution of HbS allele frequency and to quantify the uncertainty in these mapped predictions. Using a novel geostatistical approach that accounts for this uncertainty, we have compared this new map with a historical map of the global endemicity of malaria. We provide the first geographical and quantitative confirmation of the malaria hypothesis at the global scale. Methods Creating a global database of sickle cell allele frequencies A schematic overview of the methods used is provided as Figure 5. To identify publications with HbS allele frequency data, a comprehensive electronic data search was undertaken using PubMed (http://www.pubmed.gov), ISI Web of Knowledge (http://isiwebofknowledge.com) and Scopus (http://www.scopus.com), using the following keyword string: 'sickle cell' or 'haemoglobin S' or 'hemoglobin S' or 'Hb S'. Initial searches were conducted on 12 December 2007 and updated on 20 October 2009. A total of 18,336 (in Text terms), 28,908 (in Title/Keywords/Abstract) and 22,732 (in Article Title/Abstract/Keywords) references were found in the three respective databases and exported using bibliographic management software. The 2,220 references from Livingstone's extensive but out-of-date database on frequencies of haemoglobin variants5 were then added. Duplicates were removed manually. Titles and abstracts, when available, were then reviewed to identify references that met the following selection criteria: first, that the population sample was representative of an indigenous population. When multiple surveys included similar subsets of population samples, only the larger one was included, provided that all the other inclusion criteria were fulfilled. When multiple surveys were totally independent, each survey was included in the model. Few studies corresponded to a purely random or universal sample of the population studied; therefore, all unselected samples were included. Studies of patients, with sickle cell or any other condition, were excluded. We considered population surveyed as indigenous, if no information was available from the author to suspect that the population did not evolve locally in relation to the historical prevalence of malaria. Non-native populations surveyed in the Americas or Western Europe, for example, were therefore excluded. Surveys explicitly surveying a specific ethnic group, not representative of the overall population at the sampling site, were excluded. Although ethnic group information was recorded when available, it was not used in the model because of (i) inconsistency of information provided by the sources and ethnic group definitions used and (ii) contradicting local results in the relationship between ethnicity and HbS allele frequency. Second, details were needed on the number of individuals sampled and on the AA and AS genotypes identified. Sources reporting an allele frequency but no sample size were thus excluded. Because of (i) the complexity of the multiple compound status when HbS is inherited with another structural variant, haemoglobin C or HbE, or with a thalassaemia, α- or β-, (ii) the small number of individuals involved (apart from in the Mediterranean countries) and (iii) the inconsistencies in the identification of such cases, these individuals were not included in the calculations of the HbS allele frequency. Third, the survey description needed to be spatially explicit so that it could be georeferenced (see below). Using these strict criteria for inclusion, we identified 278 references with data allowing us to calculate an allele frequency for HbS (see Supplementary References 64–342). Data on absences of HbS in populations, such as native Americans, were also included in this study, as they usually constituted isolated data points that are very informative for a global predictive model. Finally, genotype data collected by the Malaria Genomic Epidemiology Network Consortium (MalariaGEN, http://www.malariagen.net)25 were added to the database as they represent a significant source of standardized data from malaria-endemic countries. Georeferencing We used the georeferencing procedure developed by the Malaria Atlas Project (MAP, http://www.map.ox.ac.uk), which is described in Guerra et al.42 Geographic coordinates could be found for 459 population samples, located as points (<10 km2). The centroid of polygons was used for the 314 population samples that could be georeferenced to district level (admin2 unit) or to a smaller area clearly defined by the author (for example, detailed map of the study area). Studies that could only be located to province (admin1 unit) or country (admin0 unit) level were excluded. Creating a continuous map of sickle cell allele frequency The number of individuals with AA and AS genotypes was used to calculate allele frequencies. Individuals described as sicklers were all considered as heterozygotes (AS). All SS individuals were assumed to die shortly after birth, meaning we discarded the few records of SS individuals in the database. Preliminary analysis (not shown) indicated that the resulting likelihood functions at points with SS individuals were very similar to those obtained using standard Hardy–Weinberg assumptions. Even today, medical services for improving the survival of sickle cell patients (SS) are rarely available outside economically developed countries, where the burden of sickle cell is greatest, and would have been more rudimentary before the 1990s, when two-thirds of the surveys were conducted. It seems reasonable therefore to assume that the few surviving HbS homozygous individuals were unlikely to substantively affect HbS allele frequency estimates. When only an allele frequency and the sample size were given, the number of AA and AS individuals was calculated by assuming that the genotypes of newborns were in Hardy–Weinberg proportions but that all SS individuals had died by the time of the surveys. The sample size was recalculated as the sum of AA and AS individuals. Information on age could not be taken into account as it was provided in only 45% of the sources. Among these, samples were taken from cord blood/neonates (n=23,152), children (n=26,205), adults (n=219,966) and mixed groups (n=78,111). The inputs to the geostatistical model were the coordinates of the population studied (lat/long in decimal degrees, WGS84) and the number of AS (positive) and AA (negative) individuals. A Bayesian geostatistical model involving a two-part nested covariance function was fitted to these data and 500,000 Markov chain Monte-Carlo iterations43 were used to predict HbS allele frequencies at unsampled locations and generate continuous maps. Because of the high heterogeneity of allele frequencies in areas in which HbS is present, the small set of HbS absences, for example, in the Americas, was not sufficient to rule out the possibility that HbS allele frequency could be relatively high in some places. For that reason, the posterior predictive distribution of allele frequencies in the Americas tended to have a long right-hand tail, and point estimates of allele frequency tended to be surprisingly high. A thinned 10% sample of the data was used to map various summary statistics of the posterior predictive distribution of HbS allele frequency at unsampled locations. To validate the predictions of the model, the analysis was repeated with 90% of the data set, and predictions at the locations of the held-out data points were evaluated. See Supplementary Methods for details on the statistical analysis. Comparing with a precontrol map of malaria endemicity In the late 1960s, a team of Russian researchers conducted a synthesis of historical records, documents and maps of several malariometric indices used to record malaria endemicity29. Combined with expert opinion and data on temperature and rainfall, this review allowed them to create a unique global map of the precontrol distribution of malaria, at the peak of its hypothesized distribution44. We chose to use this malaria map for reasons detailed in Supplementary Methods. Similar to traditional box plots, violin plots allow the comparison of a semicontinuous variable (HbS allele frequency) with a categorical variable (malaria endemicity class). In addition, they show the density distribution of the observations or predictions. The analysis of the violin plots of the allele frequencies within each endemicity class is supported by a visual interpretation of the plots. To quantify the differences between malaria endemicity classes, we calculated the probability of finding a higher allele frequency in one class than in the class just below on the basis of their geographical pattern. The posterior predictive distribution of the areal mean of the HbS allele frequency over each endemicity class was plotted by region (Fig. 4). The posterior probability of an increase in the areal mean HbS allele frequency for each pair of consecutive malaria endemicity classes, along with the Monte-Carlo standard errors associated with those estimates, was then calculated. Probabilities of zero and one indicate that the HbS allele frequency in an endemicity class is certainly lower or higher, respectively, than in the adjacent class. A probability of 0.5 corresponds to an equal chance of an increase or decrease. Further details are provided in Supplementary Methods. These comparisons have been made globally and regionally for Europe and Africa, and for Asia. The separation into these two regions was based on the distinct haplotypes occurring east and west of Saudi Arabia (see Fig. 1a)19 37. Author contributions F.B.P. and S.I.H. helped to assemble the data, developed the conceptual approach and wrote the first draft of the manuscript. R.E.H. and O.A.N. assembled and abstracted the data. A.P.P. and P.W.G. conceived and helped to implement the modelling and all computational tasks. All authors contributed to the study design and data interpretation and to the revision of the final manuscript. Additional information How to cite this article: Piel, F.B. et al. Global distribution of the sickle cell gene and geographical confirmation of the malaria hypothesis. Nat. Commun. 1:104 doi: 10.1038/ncomms1104 (2010). Supplementary Material Supplementary Figures, Supplementary Methods, Supplementary References Supplementary Figures S1–S2, Supplementary Methods and Supplementary References