3
views
0
recommends
+1 Recommend
0 collections
    0
    shares
      • Record: found
      • Abstract: found
      • Article: found
      Is Open Access

      The double burden of malnutrition among adults in India: evidence from the National Family Health Survey-4 (2015-16)

      research-article

      Read this article at

      Bookmark
          There is no author summary for this article yet. Authors can add summaries to their articles on ScienceOpen to make them more accessible to a non-specialist audience.

          Abstract

          OBJECTIVES

          India still faces the burden of undernutrition and communicable diseases, and the prevalence of overweight/obesity is steadily increasing. The discourse regarding the dual burden of underweight and overweight/obesity has not yet been widely explored in both men and women. The present study assessed the determinants of underweight and overweight/obesity in India among adult men and women aged 15-49.

          METHODS

          Population-based cross-sectional and nationally representative data from the National Family Health Survey-4 (2015-16), consisting of a sample of men and women, were analyzed. Stratified 2-stage sampling was used in the NFHS-4 study protocol. In the present study, bivariate and adjusted multinomial logistic regression analyses were performed to determine the correlates of underweight and overweight/obesity.

          RESULTS

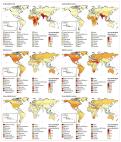
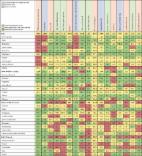
          The results suggested a persistently high prevalence of underweight coexisting with an increased prevalence of overweight/obesity in India. The risk of underweight was highest in the central and western regions and was also relatively high among those who used either smoking or smokeless tobacco. Overweight/obesity was more prevalent in urban areas, in the southern region, and among adults aged 35-49. Furthermore, level of education and wealth index were positively associated with overweight/obesity. More educated and wealthier adults were less likely to be underweight.

          CONCLUSIONS

          In India, underweight has been prevalent, and the prevalence of overweight/obesity is increasing rapidly, particularly among men. The dual burden of underweight and overweight/obesity is alarming and needs to be considered; public health measures to address this situation must also be adopted through policy initiatives.

          Related collections

          Most cited references25

          • Record: found
          • Abstract: found
          • Article: found
          Is Open Access

          Trends in adult body-mass index in 200 countries from 1975 to 2014: a pooled analysis of 1698 population-based measurement studies with 19·2 million participants

          Summary Background Underweight and severe and morbid obesity are associated with highly elevated risks of adverse health outcomes. We estimated trends in mean body-mass index (BMI), which characterises its population distribution, and in the prevalences of a complete set of BMI categories for adults in all countries. Methods We analysed, with use of a consistent protocol, population-based studies that had measured height and weight in adults aged 18 years and older. We applied a Bayesian hierarchical model to these data to estimate trends from 1975 to 2014 in mean BMI and in the prevalences of BMI categories (<18·5 kg/m2 [underweight], 18·5 kg/m2 to <20 kg/m2, 20 kg/m2 to <25 kg/m2, 25 kg/m2 to <30 kg/m2, 30 kg/m2 to <35 kg/m2, 35 kg/m2 to <40 kg/m2, ≥40 kg/m2 [morbid obesity]), by sex in 200 countries and territories, organised in 21 regions. We calculated the posterior probability of meeting the target of halting by 2025 the rise in obesity at its 2010 levels, if post-2000 trends continue. Findings We used 1698 population-based data sources, with more than 19·2 million adult participants (9·9 million men and 9·3 million women) in 186 of 200 countries for which estimates were made. Global age-standardised mean BMI increased from 21·7 kg/m2 (95% credible interval 21·3–22·1) in 1975 to 24·2 kg/m2 (24·0–24·4) in 2014 in men, and from 22·1 kg/m2 (21·7–22·5) in 1975 to 24·4 kg/m2 (24·2–24·6) in 2014 in women. Regional mean BMIs in 2014 for men ranged from 21·4 kg/m2 in central Africa and south Asia to 29·2 kg/m2 (28·6–29·8) in Polynesia and Micronesia; for women the range was from 21·8 kg/m2 (21·4–22·3) in south Asia to 32·2 kg/m2 (31·5–32·8) in Polynesia and Micronesia. Over these four decades, age-standardised global prevalence of underweight decreased from 13·8% (10·5–17·4) to 8·8% (7·4–10·3) in men and from 14·6% (11·6–17·9) to 9·7% (8·3–11·1) in women. South Asia had the highest prevalence of underweight in 2014, 23·4% (17·8–29·2) in men and 24·0% (18·9–29·3) in women. Age-standardised prevalence of obesity increased from 3·2% (2·4–4·1) in 1975 to 10·8% (9·7–12·0) in 2014 in men, and from 6·4% (5·1–7·8) to 14·9% (13·6–16·1) in women. 2·3% (2·0–2·7) of the world’s men and 5·0% (4·4–5·6) of women were severely obese (ie, have BMI ≥35 kg/m2). Globally, prevalence of morbid obesity was 0·64% (0·46–0·86) in men and 1·6% (1·3–1·9) in women. Interpretation If post-2000 trends continue, the probability of meeting the global obesity target is virtually zero. Rather, if these trends continue, by 2025, global obesity prevalence will reach 18% in men and surpass 21% in women; severe obesity will surpass 6% in men and 9% in women. Nonetheless, underweight remains prevalent in the world’s poorest regions, especially in south Asia. Funding Wellcome Trust, Grand Challenges Canada.
            Bookmark
            • Record: found
            • Abstract: found
            • Article: found
            Is Open Access

            Nations within a nation: variations in epidemiological transition across the states of India, 1990–2016 in the Global Burden of Disease Study

            Summary Background 18% of the world's population lives in India, and many states of India have populations similar to those of large countries. Action to effectively improve population health in India requires availability of reliable and comprehensive state-level estimates of disease burden and risk factors over time. Such comprehensive estimates have not been available so far for all major diseases and risk factors. Thus, we aimed to estimate the disease burden and risk factors in every state of India as part of the Global Burden of Disease (GBD) Study 2016. Methods Using all available data sources, the India State-level Disease Burden Initiative estimated burden (metrics were deaths, disability-adjusted life-years [DALYs], prevalence, incidence, and life expectancy) from 333 disease conditions and injuries and 84 risk factors for each state of India from 1990 to 2016 as part of GBD 2016. We divided the states of India into four epidemiological transition level (ETL) groups on the basis of the ratio of DALYs from communicable, maternal, neonatal, and nutritional diseases (CMNNDs) to those from non-communicable diseases (NCDs) and injuries combined in 2016. We assessed variations in the burden of diseases and risk factors between ETL state groups and between states to inform a more specific health-system response in the states and for India as a whole. Findings DALYs due to NCDs and injuries exceeded those due to CMNNDs in 2003 for India, but this transition had a range of 24 years for the four ETL state groups. The age-standardised DALY rate dropped by 36·2% in India from 1990 to 2016. The numbers of DALYs and DALY rates dropped substantially for most CMNNDs between 1990 and 2016 across all ETL groups, but rates of reduction for CMNNDs were slowest in the low ETL state group. By contrast, numbers of DALYs increased substantially for NCDs in all ETL state groups, and increased significantly for injuries in all ETL state groups except the highest. The all-age prevalence of most leading NCDs increased substantially in India from 1990 to 2016, and a modest decrease was recorded in the age-standardised NCD DALY rates. The major risk factors for NCDs, including high systolic blood pressure, high fasting plasma glucose, high total cholesterol, and high body-mass index, increased from 1990 to 2016, with generally higher levels in higher ETL states; ambient air pollution also increased and was highest in the low ETL group. The incidence rate of the leading causes of injuries also increased from 1990 to 2016. The five leading individual causes of DALYs in India in 2016 were ischaemic heart disease, chronic obstructive pulmonary disease, diarrhoeal diseases, lower respiratory infections, and cerebrovascular disease; and the five leading risk factors for DALYs in 2016 were child and maternal malnutrition, air pollution, dietary risks, high systolic blood pressure, and high fasting plasma glucose. Behind these broad trends many variations existed between the ETL state groups and between states within the ETL groups. Of the ten leading causes of disease burden in India in 2016, five causes had at least a five-times difference between the highest and lowest state-specific DALY rates for individual causes. Interpretation Per capita disease burden measured as DALY rate has dropped by about a third in India over the past 26 years. However, the magnitude and causes of disease burden and the risk factors vary greatly between the states. The change to dominance of NCDs and injuries over CMNNDs occurred about a quarter century apart in the four ETL state groups. Nevertheless, the burden of some of the leading CMNNDs continues to be very high, especially in the lowest ETL states. This comprehensive mapping of inequalities in disease burden and its causes across the states of India can be a crucial input for more specific health planning for each state as is envisioned by the Government of India's premier think tank, the National Institution for Transforming India, and the National Health Policy 2017. Funding Bill & Melinda Gates Foundation; Indian Council of Medical Research, Department of Health Research, Ministry of Health and Family Welfare, Government of India; and World Bank
              Bookmark
              • Record: found
              • Abstract: found
              • Article: found
              Is Open Access

              The impact of multimorbidity on adult physical and mental health in low- and middle-income countries: what does the study on global ageing and adult health (SAGE) reveal?

              Background Chronic diseases contribute a large share of disease burden in low- and middle-income countries (LMICs). Chronic diseases have a tendency to occur simultaneously and where there are two or more such conditions, this is termed as ‘multimorbidity’. Multimorbidity is associated with adverse health outcomes, but limited research has been undertaken in LMICs. Therefore, this study examines the prevalence and correlates of multimorbidity as well as the associations between multimorbidity and self-rated health, activities of daily living (ADLs), quality of life, and depression across six LMICs. Methods Data was obtained from the WHO’s Study on global AGEing and adult health (SAGE) Wave-1 (2007/10). This was a cross-sectional population based survey performed in LMICs, namely China, Ghana, India, Mexico, Russia, and South Africa, including 42,236 adults aged 18 years and older. Multimorbidity was measured as the simultaneous presence of two or more of eight chronic conditions including angina pectoris, arthritis, asthma, chronic lung disease, diabetes mellitus, hypertension, stroke, and vision impairment. Associations with four health outcomes were examined, namely ADL limitation, self-rated health, depression, and a quality of life index. Random-intercept multilevel regression models were used on pooled data from the six countries. Results The prevalence of morbidity and multimorbidity was 54.2 % and 21.9 %, respectively, in the pooled sample of six countries. Russia had the highest prevalence of multimorbidity (34.7 %) whereas China had the lowest (20.3 %). The likelihood of multimorbidity was higher in older age groups and was lower in those with higher socioeconomic status. In the pooled sample, the prevalence of 1+ ADL limitation was 14 %, depression 5.7 %, self-rated poor health 11.6 %, and mean quality of life score was 54.4. Substantial cross-country variations were seen in the four health outcome measures. The prevalence of 1+ ADL limitation, poor self-rated health, and depression increased whereas quality of life declined markedly with an increase in number of diseases. Conclusions Findings highlight the challenge of multimorbidity in LMICs, particularly among the lower socioeconomic groups, and the pressing need for reorientation of health care resources considering the distribution of multimorbidity and its adverse effect on health outcomes. Electronic supplementary material The online version of this article (doi:10.1186/s12916-015-0402-8) contains supplementary material, which is available to authorized users.
                Bookmark

                Author and article information

                Journal
                Epidemiol Health
                Epidemiol Health
                EPIH
                Epidemiology and Health
                Korean Society of Epidemiology
                2092-7193
                2019
                18 December 2019
                : 41
                : e2019050
                Affiliations
                [1 ]International Institute for Population Sciences (IIPS), Mumbai, India
                [2 ]Department of Development Studies, International Institute for Population Sciences (IIPS), Mumbai, India
                [3 ]Department of Humanities and Social Sciences, Indian Institute of Technology Roorkee, Roorkee, India
                [4 ]Tata Institute of Social Sciences, Mumbai, India
                Author notes
                Correspondence: Y Selvamani  Department of Development Studies, International Institute for Population Sciences (IIPS), Govandi Station Road, Mumbai 400088, India  E-mail: selvinsw@ 123456gmail.com
                Author information
                http://orcid.org/0000-0001-6539-6948
                http://orcid.org/0000-0002-1190-9127
                http://orcid.org/0000-0001-6900-1229
                http://orcid.org/0000-0001-7820-8336
                Article
                epih-41-e2019050
                10.4178/epih.e2019050
                6976728
                31962037
                93342af1-b62f-4cc6-8f64-8620ab14d385
                ©2019, Korean Society of Epidemiology

                This is an open-access article distributed under the terms of the Creative Commons Attribution License ( http://creativecommons.org/licenses/by/4.0/), which permits unrestricted use, distribution, and reproduction in any medium, provided the original work is properly cited.

                History
                : 3 August 2019
                : 18 December 2019
                Categories
                Original Article

                Public health
                thinness,overweight,obesity,nutritional status,socioeconomic factors,india
                Public health
                thinness, overweight, obesity, nutritional status, socioeconomic factors, india

                Comments

                Comment on this article