28
views
0
recommends
+1 Recommend
0 collections
    0
    shares
      • Record: found
      • Abstract: found
      • Article: found
      Is Open Access

      The Relative Caloric Prices of Healthy and Unhealthy Foods Differ Systematically across Income Levels and Continents

      research-article

      Read this article at

      Bookmark
          There is no author summary for this article yet. Authors can add summaries to their articles on ScienceOpen to make them more accessible to a non-specialist audience.

          ABSTRACT

          Background

          Relative prices of healthy/unhealthy foods have been implicated in the obesity epidemic, but never extensively quantified across countries or empirically linked to undernutrition.

          Objectives

          This study compared relative caloric prices (RCPs) for different food categories across 176 countries and ascertained their associations with dietary indicators and nutrition outcomes.

          Methods

          We converted prices for 657 standardized food products from the 2011 International Comparison Program into caloric prices using USDA Food Composition tables. We classified products into 21 specific food groups. We constructed RCPs as the ratio of the 3 cheapest products in each food group, relative to the weighted cost of a basket of starchy staples. We analyzed RCP differences across World Bank income levels and regions and used cross-country regressions to explore associations with Demographic Health Survey dietary indicators for women 15–49 y old and children 12–23 mo old and with WHO indicators of the under-5 stunting prevalence and adult overweight prevalence.

          Results

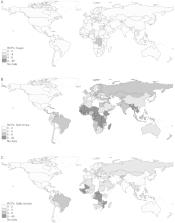
          Most noncereal foods were relatively cheap in high-income countries, including sugar- and fat-rich foods. In lower-income countries, healthy foods were generally expensive, especially most animal-sourced foods and fortified infant cereals (FICs). Higher RCPs for a food predict lower consumption among children for 7 of 9 food groups. Higher milk and FIC prices were positively associated with international child stunting patterns: a 1-SD increase in milk prices was associated with a 2.8 percentage point increase in the stunting prevalence. Similarly, a 1-SD increase in soft drink prices was associated with a reduction in the overweight prevalence of ∼3.6 percentage points.

          Conclusions

          Relative food prices vary systematically across countries and partially explain international differences in the prevalences of undernutrition and overweight adults. Future research should focus on how to alter relative prices to achieve better dietary and nutrition outcomes.

          Related collections

          Most cited references26

          • Record: found
          • Abstract: found
          • Article: not found

          A comparative risk assessment of burden of disease and injury attributable to 67 risk factors and risk factor clusters in 21 regions, 1990–2010: a systematic analysis for the Global Burden of Disease Study 2010

          The Lancet, 380(9859), 2224-2260
            Bookmark
            • Record: found
            • Abstract: found
            • Article: found
            Is Open Access

            Global, regional and national consumption of major food groups in 1990 and 2010: a systematic analysis including 266 country-specific nutrition surveys worldwide

            Objective To quantify global intakes of key foods related to non-communicable diseases in adults by region (n=21), country (n=187), age and sex, in 1990 and 2010. Design We searched and obtained individual-level intake data in 16 age/sex groups worldwide from 266 surveys across 113 countries. We combined these data with food balance sheets available in all nations and years. A hierarchical Bayesian model estimated mean food intake and associated uncertainty for each age-sex-country-year stratum, accounting for differences in intakes versus availability, survey methods and representativeness, and sampling and modelling uncertainty. Setting/population Global adult population, by age, sex, country and time. Results In 2010, global fruit intake was 81.3 g/day (95% uncertainty interval 78.9–83.7), with country-specific intakes ranging from 19.2–325.1 g/day; in only 2 countries (representing 0.4% of the world's population), mean intakes met recommended targets of ≥300 g/day. Country-specific vegetable intake ranged from 34.6–493.1 g/day (global mean=208.8 g/day); corresponding values for nuts/seeds were 0.2–152.7 g/day (8.9 g/day); for whole grains, 1.3–334.3 g/day (38.4 g/day); for seafood, 6.0–87.6 g/day (27.9 g/day); for red meats, 3.0–124.2 g/day (41.8 g/day); and for processed meats, 2.5–66.1 g/day (13.7 g/day). Mean national intakes met recommended targets in countries representing 0.4% of the global population for vegetables (≥400 g/day); 9.6% for nuts/seeds (≥4 (28.35 g) servings/week); 7.6% for whole grains (≥2.5 (50 g) servings/day); 4.4% for seafood (≥3.5 (100 g) servings/week); 20.3% for red meats (≤1 (100 g) serving/week); and 38.5% for processed meats (≤1 (50 g) serving/week). Intakes of healthful foods were generally higher and of less healthful foods generally lower at older ages. Intakes were generally similar by sex. Vegetable, seafood and processed meat intakes were stable over time; fruits, nuts/seeds and red meat, increased; and whole grains, decreased. Conclusions These global dietary data by nation, age and sex identify key challenges and opportunities for optimising diets, informing policies and priorities for improving global health.
              Bookmark
              • Record: found
              • Abstract: found
              • Article: not found

              The Nutrient Rich Foods Index helps to identify healthy, affordable foods.

              The Nutrient Rich Foods (NRF) Index is a formal scoring system that ranks foods on the basis of their nutrient content. When used in conjunction with a food prices database, it can help identify foods that are both nutritious and affordable. Our aim was to identify healthy, affordable foods and food groups by using the NRF index and US Department of Agriculture (USDA) nutrient composition and food prices data sets. Foods in the USDA Food and Nutrition Database for Dietary Studies 1.0 were scored by using the NRF index. This NRF algorithm was represented by the sum of the percentage of the daily values of 9 nutrients to encourage (protein, fiber, vitamin A, vitamin C, vitamin E, calcium, iron, magnesium, and potassium) minus the sum of the percentage of the maximum recommended values for 3 nutrients to limit (saturated fat, added sugar, and sodium). NRF scores and mean national food prices were calculated per calorie and per US Food and Drug Administration-defined serving. Each of the 9 USDA food groups offered foods of diverse nutritive value and cost. Eggs, dry beans and legumes, and meat and milk products were the lowest-cost sources of protein. Milk and milk products were the lowest-cost sources of calcium, whereas vegetables and fruit were the lowest-cost sources of vitamin C. Milk, potatoes, citrus juices, cereals, and beans had more favorable overall nutrient-to-price ratios than did many vegetables and fruit. Energy-dense grains, sweets, and fats provided most of the calories but fewer nutrients per dollar. One important application of nutrient profile models is to help consumers identify foods that provide optimal nutrition at an affordable cost.
                Bookmark

                Author and article information

                Journal
                J Nutr
                J. Nutr
                jn
                The Journal of Nutrition
                Oxford University Press
                0022-3166
                1541-6100
                November 2019
                23 July 2019
                23 July 2019
                : 149
                : 11
                : 2020-2033
                Affiliations
                [1] International Food Policy Research Institute , Washington DC, USA
                Author notes
                Address correspondence to DDH (e-mail: d.headey@ 123456cgiar.org )
                Author information
                http://orcid.org/0000-0001-8019-6397
                Article
                nxz158
                10.1093/jn/nxz158
                6825829
                31332436
                6cef663b-5adf-4696-a9f2-bfd9d1976ba3
                Copyright © American Society for Nutrition 2019.

                This is an Open Access article distributed under the terms of the Creative Commons Attribution License ( http://creativecommons.org/licenses/by/4.0/), which permits unrestricted reuse, distribution, and reproduction in any medium, provided the original work is properly cited.

                History
                : 08 October 2018
                : 27 November 2018
                : 11 June 2019
                Page count
                Pages: 14
                Funding
                Funded by: Advancing Research on Nutrition and Agriculture
                Funded by: Bill & Melinda Gates Foundation 10.13039/100000865
                Award ID: OPP1112307
                Funded by: Consultative Group on International Agricultural Research
                Funded by: Program on Agriculture for Nutrition and Health
                Categories
                Community and International Nutrition
                Original Research Article
                Editor's Choice

                Nutrition & Dietetics
                food prices,undernutrition,obesity,food systems,dietary patterns
                Nutrition & Dietetics
                food prices, undernutrition, obesity, food systems, dietary patterns

                Comments

                Comment on this article