60
views
0
recommends
+1 Recommend
3 collections
    0
    shares
      • Record: found
      • Abstract: found
      • Article: found
      Is Open Access

      The state of health in Pakistan and its provinces and territories, 1990–2019: a systematic analysis for the Global Burden of Disease Study 2019

      research-article
      GBD 2019 Pakistan Collaborators
      The Lancet. Global Health
      Elsevier Ltd

      Read this article at

      Bookmark
          There is no author summary for this article yet. Authors can add summaries to their articles on ScienceOpen to make them more accessible to a non-specialist audience.

          Summary

          Background

          Understanding health trends and estimating the burden of disease at the national and subnational levels helps policy makers track progress and identify disparities in overall health performance. The Global Burden of Diseases, Injuries, and Risk Factors Study (GBD) 2019 provides comprehensive estimates for Pakistan. Comparison of health indicators since 1990 provides valuable insights about Pakistan's ability to strengthen its health-care system, reduce inequalities, improve female and child health outcomes, achieve universal health coverage, and meet the UN Sustainable Development Goals. We present estimates of the burden of disease, injuries, and risk factors for Pakistan provinces and territories from 1990 to 2019 based on GBD 2019 to improve health and health outcomes in the country.

          Methods

          We used methods and data inputs from GBD 2019 to estimate socio-demographic index, total fertility rate, cause-specific deaths, years of life lost, years lived with disability, disability-adjusted life-years, healthy life expectancy, and risk factors for 286 causes of death and 369 causes of non-fatal health loss in Pakistan and its four provinces and three territories from 1990 to 2019. To generate estimates for Pakistan at the national and subnational levels, we used 68 location-years of data to estimate Pakistan-specific demographic indicators, 316 location-years of data for Pakistan-specific causes of death, 579 location-years of data for Pakistan-specific non-fatal outcomes, 296 location-years of data for Pakistan-specific risk factors, and 3089 location-years of data for Pakistan-specific covariates.

          Findings

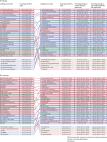
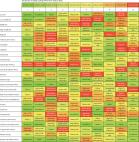
          Life expectancy for both sexes in Pakistan increased nationally from 61·1 (95% uncertainty interval [UI] 60·0–62·1) years in 1990 to 65·9 (63·8–67·8) years in 2019; however, these gains were not uniform across the provinces and federal territories. Pakistan saw a narrowing of the difference in healthy life expectancy between the sexes from 1990 to 2019, as health gains for women occurred at faster rates than for men. For women, life expectancy increased by 8·2% (95% UI 6·3–13·8) between 1990 and 2019, whereas the male life expectancy increased by 7·6% (3·5–11·8). Neonatal disorders, followed by ischaemic heart disease, stroke, diarrhoeal diseases, and lower respiratory infections were the leading causes of all-age premature mortality in 2019. Child and maternal malnutrition, air pollution, high systolic blood pressure, dietary risks, and tobacco consumption were the leading all-age risk factors for death and disability-adjusted life-years at the national level in 2019. Five non-communicable diseases—ischaemic heart disease, stroke, congenital defects, cirrhosis, and chronic kidney disease—were among the ten leading causes of years of life lost in Pakistan. Burden varied by socio-demographic index. Notably, Balochistan and Khyber Pakhtunkhwa had the lowest observed gains in life expectancy. Dietary iron deficiency was the leading cause of years lived with disability for both men and women in 1990 and 2019. Low birthweight and short gestation and particulate matter pollution were the leading contributors to overall disease burden in both 1990 and 2019 despite moderate improvements, with a 23·5% (95% UI 3·8–39·2) and 27·6% (14·3–38·6) reduction in age-standardised attributable DALY rates during the study period.

          Interpretation

          Our study shows that progress has been made on reducing Pakistan's disease burden since 1990, but geographical, age, and sex disparities persist. Equitable investment in the health system, as well as the prioritisation of high-impact policy interventions and programmes, are needed to save lives and improve health outcomes. Pakistan is facing several domestic and foreign challenges—the Taliban's return to power in Afghanistan, political turmoil, catastrophic flooding, the COVID-19 pandemic—that will shape the trajectory of the country's health and development. Pakistan must address the burden of infectious disease and curb rising rates of non-communicable diseases. Prioritising these three areas will enhance Pakistan's ability to achieve universal health coverage, meet its Sustainable Development Goals, and improve the overall health outcomes.

          Funding

          Bill & Melinda Gates Foundation.

          Translation

          For the Urdu translation of the abstract see Supplementary Materials section.

          Related collections

          Most cited references37

          • Record: found
          • Abstract: found
          • Article: found
          Is Open Access

          Global burden of 369 diseases and injuries in 204 countries and territories, 1990–2019: a systematic analysis for the Global Burden of Disease Study 2019

          Summary Background In an era of shifting global agendas and expanded emphasis on non-communicable diseases and injuries along with communicable diseases, sound evidence on trends by cause at the national level is essential. The Global Burden of Diseases, Injuries, and Risk Factors Study (GBD) provides a systematic scientific assessment of published, publicly available, and contributed data on incidence, prevalence, and mortality for a mutually exclusive and collectively exhaustive list of diseases and injuries. Methods GBD estimates incidence, prevalence, mortality, years of life lost (YLLs), years lived with disability (YLDs), and disability-adjusted life-years (DALYs) due to 369 diseases and injuries, for two sexes, and for 204 countries and territories. Input data were extracted from censuses, household surveys, civil registration and vital statistics, disease registries, health service use, air pollution monitors, satellite imaging, disease notifications, and other sources. Cause-specific death rates and cause fractions were calculated using the Cause of Death Ensemble model and spatiotemporal Gaussian process regression. Cause-specific deaths were adjusted to match the total all-cause deaths calculated as part of the GBD population, fertility, and mortality estimates. Deaths were multiplied by standard life expectancy at each age to calculate YLLs. A Bayesian meta-regression modelling tool, DisMod-MR 2.1, was used to ensure consistency between incidence, prevalence, remission, excess mortality, and cause-specific mortality for most causes. Prevalence estimates were multiplied by disability weights for mutually exclusive sequelae of diseases and injuries to calculate YLDs. We considered results in the context of the Socio-demographic Index (SDI), a composite indicator of income per capita, years of schooling, and fertility rate in females younger than 25 years. Uncertainty intervals (UIs) were generated for every metric using the 25th and 975th ordered 1000 draw values of the posterior distribution. Findings Global health has steadily improved over the past 30 years as measured by age-standardised DALY rates. After taking into account population growth and ageing, the absolute number of DALYs has remained stable. Since 2010, the pace of decline in global age-standardised DALY rates has accelerated in age groups younger than 50 years compared with the 1990–2010 time period, with the greatest annualised rate of decline occurring in the 0–9-year age group. Six infectious diseases were among the top ten causes of DALYs in children younger than 10 years in 2019: lower respiratory infections (ranked second), diarrhoeal diseases (third), malaria (fifth), meningitis (sixth), whooping cough (ninth), and sexually transmitted infections (which, in this age group, is fully accounted for by congenital syphilis; ranked tenth). In adolescents aged 10–24 years, three injury causes were among the top causes of DALYs: road injuries (ranked first), self-harm (third), and interpersonal violence (fifth). Five of the causes that were in the top ten for ages 10–24 years were also in the top ten in the 25–49-year age group: road injuries (ranked first), HIV/AIDS (second), low back pain (fourth), headache disorders (fifth), and depressive disorders (sixth). In 2019, ischaemic heart disease and stroke were the top-ranked causes of DALYs in both the 50–74-year and 75-years-and-older age groups. Since 1990, there has been a marked shift towards a greater proportion of burden due to YLDs from non-communicable diseases and injuries. In 2019, there were 11 countries where non-communicable disease and injury YLDs constituted more than half of all disease burden. Decreases in age-standardised DALY rates have accelerated over the past decade in countries at the lower end of the SDI range, while improvements have started to stagnate or even reverse in countries with higher SDI. Interpretation As disability becomes an increasingly large component of disease burden and a larger component of health expenditure, greater research and development investment is needed to identify new, more effective intervention strategies. With a rapidly ageing global population, the demands on health services to deal with disabling outcomes, which increase with age, will require policy makers to anticipate these changes. The mix of universal and more geographically specific influences on health reinforces the need for regular reporting on population health in detail and by underlying cause to help decision makers to identify success stories of disease control to emulate, as well as opportunities to improve. Funding Bill & Melinda Gates Foundation.
            Bookmark
            • Record: found
            • Abstract: found
            • Article: found
            Is Open Access

            Global burden of 87 risk factors in 204 countries and territories, 1990–2019: a systematic analysis for the Global Burden of Disease Study 2019

            Summary Background Rigorous analysis of levels and trends in exposure to leading risk factors and quantification of their effect on human health are important to identify where public health is making progress and in which cases current efforts are inadequate. The Global Burden of Diseases, Injuries, and Risk Factors Study (GBD) 2019 provides a standardised and comprehensive assessment of the magnitude of risk factor exposure, relative risk, and attributable burden of disease. Methods GBD 2019 estimated attributable mortality, years of life lost (YLLs), years of life lived with disability (YLDs), and disability-adjusted life-years (DALYs) for 87 risk factors and combinations of risk factors, at the global level, regionally, and for 204 countries and territories. GBD uses a hierarchical list of risk factors so that specific risk factors (eg, sodium intake), and related aggregates (eg, diet quality), are both evaluated. This method has six analytical steps. (1) We included 560 risk–outcome pairs that met criteria for convincing or probable evidence on the basis of research studies. 12 risk–outcome pairs included in GBD 2017 no longer met inclusion criteria and 47 risk–outcome pairs for risks already included in GBD 2017 were added based on new evidence. (2) Relative risks were estimated as a function of exposure based on published systematic reviews, 81 systematic reviews done for GBD 2019, and meta-regression. (3) Levels of exposure in each age-sex-location-year included in the study were estimated based on all available data sources using spatiotemporal Gaussian process regression, DisMod-MR 2.1, a Bayesian meta-regression method, or alternative methods. (4) We determined, from published trials or cohort studies, the level of exposure associated with minimum risk, called the theoretical minimum risk exposure level. (5) Attributable deaths, YLLs, YLDs, and DALYs were computed by multiplying population attributable fractions (PAFs) by the relevant outcome quantity for each age-sex-location-year. (6) PAFs and attributable burden for combinations of risk factors were estimated taking into account mediation of different risk factors through other risk factors. Across all six analytical steps, 30 652 distinct data sources were used in the analysis. Uncertainty in each step of the analysis was propagated into the final estimates of attributable burden. Exposure levels for dichotomous, polytomous, and continuous risk factors were summarised with use of the summary exposure value to facilitate comparisons over time, across location, and across risks. Because the entire time series from 1990 to 2019 has been re-estimated with use of consistent data and methods, these results supersede previously published GBD estimates of attributable burden. Findings The largest declines in risk exposure from 2010 to 2019 were among a set of risks that are strongly linked to social and economic development, including household air pollution; unsafe water, sanitation, and handwashing; and child growth failure. Global declines also occurred for tobacco smoking and lead exposure. The largest increases in risk exposure were for ambient particulate matter pollution, drug use, high fasting plasma glucose, and high body-mass index. In 2019, the leading Level 2 risk factor globally for attributable deaths was high systolic blood pressure, which accounted for 10·8 million (95% uncertainty interval [UI] 9·51–12·1) deaths (19·2% [16·9–21·3] of all deaths in 2019), followed by tobacco (smoked, second-hand, and chewing), which accounted for 8·71 million (8·12–9·31) deaths (15·4% [14·6–16·2] of all deaths in 2019). The leading Level 2 risk factor for attributable DALYs globally in 2019 was child and maternal malnutrition, which largely affects health in the youngest age groups and accounted for 295 million (253–350) DALYs (11·6% [10·3–13·1] of all global DALYs that year). The risk factor burden varied considerably in 2019 between age groups and locations. Among children aged 0–9 years, the three leading detailed risk factors for attributable DALYs were all related to malnutrition. Iron deficiency was the leading risk factor for those aged 10–24 years, alcohol use for those aged 25–49 years, and high systolic blood pressure for those aged 50–74 years and 75 years and older. Interpretation Overall, the record for reducing exposure to harmful risks over the past three decades is poor. Success with reducing smoking and lead exposure through regulatory policy might point the way for a stronger role for public policy on other risks in addition to continued efforts to provide information on risk factor harm to the general public. Funding Bill & Melinda Gates Foundation.
              Bookmark
              • Record: found
              • Abstract: found
              • Article: not found

              Global prevalence and burden of depressive and anxiety disorders in 204 countries and territories in 2020 due to the COVID-19 pandemic

              (2021)
              Background Before 2020, mental disorders were leading causes of the global health-related burden, with depressive and anxiety disorders being leading contributors to this burden. The emergence of the COVID-19 pandemic has created an environment where many determinants of poor mental health are exacerbated. The need for up-to-date information on the mental health impacts of COVID-19 in a way that informs health system responses is imperative. In this study, we aimed to quantify the impact of the COVID-19 pandemic on the prevalence and burden of major depressive disorder and anxiety disorders globally in 2020. Methods We conducted a systematic review of data reporting the prevalence of major depressive disorder and anxiety disorders during the COVID-19 pandemic and published between Jan 1, 2020, and Jan 29, 2021. We searched PubMed, Google Scholar, preprint servers, grey literature sources, and consulted experts. Eligible studies reported prevalence of depressive or anxiety disorders that were representative of the general population during the COVID-19 pandemic and had a pre-pandemic baseline. We used the assembled data in a meta-regression to estimate change in the prevalence of major depressive disorder and anxiety disorders between pre-pandemic and mid-pandemic (using periods as defined by each study) via COVID-19 impact indicators (human mobility, daily SARS-CoV-2 infection rate, and daily excess mortality rate). We then used this model to estimate the change from pre-pandemic prevalence (estimated using Disease Modelling Meta-Regression version 2.1 [known as DisMod-MR 2.1]) by age, sex, and location. We used final prevalence estimates and disability weights to estimate years lived with disability and disability-adjusted life-years (DALYs) for major depressive disorder and anxiety disorders. Findings We identified 5683 unique data sources, of which 48 met inclusion criteria (46 studies met criteria for major depressive disorder and 27 for anxiety disorders). Two COVID-19 impact indicators, specifically daily SARS-CoV-2 infection rates and reductions in human mobility, were associated with increased prevalence of major depressive disorder (regression coefficient [ B ] 0·9 [95% uncertainty interval 0·1 to 1·8; p=0·029] for human mobility, 18·1 [7·9 to 28·3; p=0·0005] for daily SARS-CoV-2 infection) and anxiety disorders (0·9 [0·1 to 1·7; p=0·022] and 13·8 [10·7 to 17·0; p<0·0001]. Females were affected more by the pandemic than males ( B 0·1 [0·1 to 0·2; p=0·0001] for major depressive disorder, 0·1 [0·1 to 0·2; p=0·0001] for anxiety disorders) and younger age groups were more affected than older age groups (−0·007 [–0·009 to −0·006; p=0·0001] for major depressive disorder, −0·003 [–0·005 to −0·002; p=0·0001] for anxiety disorders). We estimated that the locations hit hardest by the pandemic in 2020, as measured with decreased human mobility and daily SARS-CoV-2 infection rate, had the greatest increases in prevalence of major depressive disorder and anxiety disorders. We estimated an additional 53·2 million (44·8 to 62·9) cases of major depressive disorder globally (an increase of 27·6% [25·1 to 30·3]) due to the COVID-19 pandemic, such that the total prevalence was 3152·9 cases (2722·5 to 3654·5) per 100 000 population. We also estimated an additional 76·2 million (64·3 to 90·6) cases of anxiety disorders globally (an increase of 25·6% [23·2 to 28·0]), such that the total prevalence was 4802·4 cases (4108·2 to 5588·6) per 100 000 population. Altogether, major depressive disorder caused 49·4 million (33·6 to 68·7) DALYs and anxiety disorders caused 44·5 million (30·2 to 62·5) DALYs globally in 2020. Interpretation This pandemic has created an increased urgency to strengthen mental health systems in most countries. Mitigation strategies could incorporate ways to promote mental wellbeing and target determinants of poor mental health and interventions to treat those with a mental disorder. Taking no action to address the burden of major depressive disorder and anxiety disorders should not be an option. Funding Queensland Health, National Health and Medical Research Council, and the Bill and Melinda Gates Foundation.
                Bookmark

                Author and article information

                Journal
                Lancet Glob Health
                Lancet Glob Health
                The Lancet. Global Health
                Elsevier Ltd
                2214-109X
                18 January 2023
                February 2023
                18 January 2023
                : 11
                : 2
                : e229-e243
                Author notes
                [* ]Correspondence to: Prof Ali H Mokdad, Institute for Health Metrics and Evaluation, University of Washington, Seattle, WA 98195, USA mokdaa@ 123456uw.edu
                [†]

                Listed at the end of the Article

                Article
                S2214-109X(22)00497-1
                10.1016/S2214-109X(22)00497-1
                10009760
                36669807
                4352a934-e2df-4043-94f1-e2c2165089e3
                © 2023 The Author(s). Published by Elsevier Ltd. This is an Open Access article under the CC BY-NC-ND 4.0 license

                This is an open access article under the CC BY-NC-ND license (http://creativecommons.org/licenses/by-nc-nd/4.0/).

                History
                Categories
                Articles

                Comments

                Comment on this article