22
views
0
recommends
+1 Recommend
2 collections
    0
    shares
      • Record: found
      • Abstract: found
      • Article: found
      Is Open Access

      Update: Characteristics of Health Care Personnel with COVID-19 — United States, February 12–July 16, 2020

      research-article

      Read this article at

      Bookmark
          There is no author summary for this article yet. Authors can add summaries to their articles on ScienceOpen to make them more accessible to a non-specialist audience.

          Abstract

          As of September 21, 2020, the coronavirus disease 2019 (COVID-19) pandemic had resulted in 6,786,352 cases and 199,024 deaths in the United States.* Health care personnel (HCP) are essential workers at risk for exposure to patients or infectious materials ( 1 ). The impact of COVID-19 on U.S. HCP was first described using national case surveillance data in April 2020 ( 2 ). Since then, the number of reported HCP with COVID-19 has increased tenfold. This update describes demographic characteristics, underlying medical conditions, hospitalizations, and intensive care unit (ICU) admissions, stratified by vital status, among 100,570 HCP with COVID-19 reported to CDC during February 12–July 16, 2020. HCP occupation type and job setting are newly reported. HCP status was available for 571,708 (22%) of 2,633,585 cases reported to CDC. Most HCP with COVID-19 were female (79%), aged 16–44 years (57%), not hospitalized (92%), and lacked all 10 underlying medical conditions specified on the case report form † (56%). Of HCP with COVID-19, 641 died. Compared with nonfatal COVID-19 HCP cases, a higher percentage of fatal cases occurred in males (38% versus 22%), persons aged ≥65 years (44% versus 4%), non-Hispanic Asians (Asians) (20% versus 9%), non-Hispanic Blacks (Blacks) (32% versus 25%), and persons with any of the 10 underlying medical conditions specified on the case report form (92% versus 41%). From a subset of jurisdictions reporting occupation type or job setting for HCP with COVID-19, nurses were the most frequently identified single occupation type (30%), and nursing and residential care facilities were the most common job setting (67%). Ensuring access to personal protective equipment (PPE) and training, and practices such as universal use of face masks at work, wearing masks in the community, and observing social distancing remain critical strategies to protect HCP and those they serve. Data from laboratory-confirmed and probable COVID-19 cases, voluntarily reported to CDC from state, local, and territorial health departments during February 12–July 16, 2020, were analyzed. COVID-19 cases are reported using a standardized case report form, which collects information on demographic characteristics, whether the case occurred in a U.S. health care worker (HCP status), symptom onset date, underlying medical conditions, hospitalization, ICU admission, and death. HCP occupation type and job setting were added to the case report form in May, enabling prospective and retrospective entry of these elements. Case surveillance data were enriched with additional cases from a COVID-19 mortality-focused supplementary surveillance effort in three jurisdictions § ( 3 ). Descriptive analyses were used to examine characteristics by vital status. HCP occupation type and job setting were reported by a subset of jurisdictions with at least five HCP cases for each variable. Analyses were conducted using Stata (version 15.1; StataCorp) and SAS (version 9.4; SAS Institute). Among 2,633,585 U.S. COVID-19 cases reported individually to CDC during February 12–July 16, HCP status was available for 571,708 (22%) persons, among whom 100,481 (18%) were identified as HCP. Data completeness for HCP status varied by jurisdiction; among jurisdictions that included HCP status on ≥70% of cases and reported at least one HCP case (11), HCP accounted for 14% (14,938 of 109,293) of cases with HCP status available and 11% (14,938 of 132,340) of all reported cases. Case report form data were enriched with 89 additional HCP cases using supplementary mortality data; thus, the final HCP case total for analysis was 100,570 (Table 1). TABLE 1 Demographics, underlying medical conditions, hospitalization status, and intensive care unit (ICU) status among health care personnel (HCP) with COVID-19, by vital status — United States, February 12–July 16, 2020 Characteristic* No. (%) Case fatality ratio,§ no./total no. Total Alive Deceased† Unknown Total 100,570 67,105 641 32,824 0.95 (641/67,746) Age group (yrs) N = 100,432 N = 67,023 N = 641 N = 32,768 — 16–44 57,742 (57) 39,018 (58) 57 (9) 18,667 (57) 0.15 (57/39,075) 45–54 20,981 (21) 13,836 (21) 99 (15) 7,046 (22) 0.71 (99/13,935) 55–64 17,052 (17) 11,264 (17) 205 (32) 5,583 (17) 1.79 (205/11,469) ≥65 4,657 (5) 2,905 (4) 280 (44) 1,472 (4) 8.79 (280/3,185) Sex N = 99,741 N = 66,796 N = 639 N = 32,306 — Female 78,328 (79) 52,366 (78) 395 (62) 25,567 (79) 0.75 (395/52,761) Male 21,413 (21) 14,430 (22) 244 (38) 6,739 (21) 1.66 (244/14,674) Race/Ethnicity N = 69,678 N = 45,104 N = 552 N = 24,022 — American Indian/Alaska Native, non-Hispanic 253 (0) 186 (0) 0 (0) 67 (0) — Asian, non-Hispanic 6,010 (9) 4,083 (9) 111 (20) 1,816 (8) 2.65 (111/4,194) Black, non-Hispanic 18,117 (26) 11,172 (25) 177 (32) 6,768 (28) 1.56 (177/11,349) Hispanic/Latino¶ 8,030 (12) 4,262 (9) 49 (9) 3,719 (15) 1.14 (49/4,311) Multiple/Other, non-Hispanic 4,195 (6) 2,662 (6) 13 (2) 1,520 (6) 0.49 (13/2,675) Native Hawaiian/Other Pacific Islander, non-Hispanic 422 (1) 314 (1) 4 (1) 104 (0) 1.26 (4/318) White, non-Hispanic 32,651 (47) 22,425 (50) 198 (36) 10,028 (42) 0.88 (198/22,623) Underlying medical conditions** N = 40,582 N = 26,868 N = 378 N = 13,336 — Any underlying medical condition 17,838 (44) 11,012 (41) 348 (92) 6,478 (49) 3.06 (348/11,360) Any chronic lung disease 6,422 (16) 4,064 (15) 89 (24) 2,269 (17) 2.14 (89/4,153) Any cardiovascular disease 7,348 (18) 4,331 (16) 229 (61) 2,788 (21) 5.02 (229/4,560) Diabetes mellitus 5,466 (13) 3,314 (12) 198 (52) 1,954 (15) 5.64 (198/3,512) Immunosuppressing condition 1,504 (4) 1,070 (4) 24 (6) 410 (3) 2.19 (24/1,094) Severe obesity 1,101 (3) 453 (2) 27 (7) 621 (5) 5.63 (27/480) Chronic renal disease 503 (1) 279 (1) 45 (12) 179 (1) 13.89 (45/324) Neurologic/Neurodevelopmental disability 528 (1) 333 (1) 34 (9) 161 (1) 9.26 (34/367) Chronic liver disease 242 (1) 148 (1) 10 (3) 84 (1) 6.33 (10/158) Autoimmune condition 479 (1) 262 (1) 3 (1) 214 (2) 1.13 (3/265) Psychologic/psychiatric condition 353 (1) 191 (1) 4 (1) 158 (1) 2.05 (4/195) Admission to hospital N = 83,202 N = 55,415 N = 591 N = 27,196 — Yes 6,832 (8) 4,207 (8) 518 (88) 2,107 (8) 10.96 (518/4,725) Admission to ICU N = 33,694 N = 22,545 N = 377 N = 10,772 — Yes 1,684 (5) 662 (3) 295 (78) 727 (7) 30.83 (295/957) Abbreviation: COVID-19 = coronavirus disease 2019. * Variable completeness varied by case characteristic: age (>99%), sex (99%), race and ethnicity (69%), hospitalization status (83%), ICU admission status (34%); characteristic-specific sample size for cases with available information are presented for each grouping. N = number with available information. † Death outcomes were known for 67,746 (67%) HCP cases; of these, 91 additional new fatal cases were included based on data from the supplementary mortality project (89 newly identified as HCP and two newly identified deaths among known HCP). Additional available data for these 91 cases were incorporated if missing in the national case surveillance data. § Deaths per 100 HCP cases with known death status. ¶ Cases reported as Hispanic were categorized as “Hispanic or Latino persons of any race” regardless of availability of race data. ** Underlying medical condition status was classified as “known” if any of these 10 conditions, specified on the standard case report form, were reported as present or absent: diabetes mellitus, cardiovascular disease (includes hypertension), severe obesity (body mass index ≥40 kg/m2), chronic renal disease, chronic liver disease, chronic lung disease, immunosuppressing condition, autoimmune condition, neurologic condition (including neurodevelopmental, intellectual, physical, visual, or health impairment), or psychologic/psychiatric condition. Status for these conditions was “known” for 40,582 persons. Responses include data from standardized fields supplemented with data from the free text field for “other chronic disease/underlying condition” for the 10 specific medical conditions, if not originally specified. Among HCP with COVID-19 overall, the median age was 41 years (interquartile range = 30–53 years); 79% of cases were in females. Among 69,678 (69%) HCP cases with data on race and ethnicity, 47% were in non-Hispanic Whites (Whites), 26% were in Blacks, 12% were in Hispanics or Latinos of any race (Hispanics), and 9% were in Asians. Of persons with known hospitalization or ICU admission status, 8% (6,832 of 83,202) were hospitalized and 5% (1,684 of 33,694) were treated in an ICU. Vital status was known for 67% (67,746) of HCP with COVID-19; among those, 641 (1%) died. Deaths among HCP with COVID-19 were reported in 22 jurisdictions. Compared with those who survived, decedents tended to be older (median age = 62 versus 40 years), male (38% versus 22%), Asian (20% versus 9%), or Black (32% versus 25%). Among HCP cases with data on one or more of 10 underlying medical conditions specified on the case report form, 17,838 (44%) persons had at least one condition. The most common were cardiovascular disease (18%), chronic lung disease (16%), and diabetes mellitus (13%). The vast majority (92%) of fatal HCP cases were among HCP with an underlying medical condition. More than one half had cardiovascular disease (61%) or diabetes mellitus (52%), conditions known to increase the risk for severe COVID-19 ¶ ; 32% were reported to have both conditions (Table 1). 
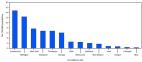
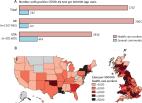
Six jurisdictions reported the occupation type** or job setting †† for at least five HCP with COVID-19 (Table 2). Among HCP with COVID-19 in these jurisdictions, occupation type was available for 59% (5,913 of 9,984) and job setting for 41% (6,955 of 17,052). Health care support workers accounted for the largest overall group of occupation types (32%), and nurses constituted the largest single occupation type (30%) (Table 2). Within this subset of HCP cases, two thirds (67%) were in persons reported to work in nursing and residential care facilities. TABLE 2 Occupation type and job setting of health care personnel (HCP) with COVID-19 — six jurisdictions,* February 12–July 16, 2020 Characteristic (no. with available information)† No. (%) Occupation type (5,913)§ Health care support worker¶ 1,895 (32.1) Nurse** 1,742 (29.5) Administrative staff member 581 (9.8) Environmental services worker 330 (5.6) Physician 190 (3.2) Medical technician 135 (2.3) Behavioral health worker 128 (2.2) First responder 113 (1.9) Dietary services worker 113 (1.9) Dental worker 98 (1.7) Laboratorian 68 (1.2) Occupational, physical, or speech therapist 65 (1.1) Pharmacy worker 62 (1.1) Respiratory therapist 44 (0.7) Phlebotomist 25 (0.4) Physician assistant 13 (0.2) Other 311 (5.3) Job setting (6,955)§ Nursing and residential care facility††,§§ 4,649 (66.8) Hospital 1,231 (17.7) Ambulatory health care service¶¶ 804 (11.6) Other 271 (3.9) Abbreviation: COVID-19 = coronavirus disease 2019. * Alaska, Kansas, Michigan, Minnesota, North Carolina, and Utah. † Occupation type data are included for five jurisdictions (Alaska, Kansas, Minnesota, North Carolina, and Utah) that reported occupation type for at least five HCP COVID-19 cases; occupation type data were known for 59% (5,913 of 9,984) of HCP cases in those jurisdictions. Job setting data are included for five jurisdictions (Alaska, Kansas, Michigan, Minnesota, and Utah) that reported job setting for at least five HCP COVID-19 cases; job setting data were known for 41% (6,955 of 17,052) of HCP cases in those jurisdictions. § Occupation type and job setting categories were determined either by inclusion on the CDC case report form or by manual review and categorization of free-text entries within “other, specify” fields. Free-text data were used to supplement existing categories for occupation (nurse, environmental services worker, physician, respiratory therapist) and setting (long-term care facility [including nursing home/assisted living facility], hospital, rehabilitation facility) and create new categories. ¶ Includes nursing assistant (1,444), medical assistant (123), and other care provider or aide (328); free-text fields were used to create new categories. **Includes data from standardized fields (1,724) supplemented with data from free-text fields (18); types of nurses or nursing specialties are not specified. †† Includes long-term care facility (including nursing home/assisted living facility) (4,424), rehabilitation facility (131), and group home (94). §§ Michigan provides job setting data only for cases identified from long-term care facilities (2,800). ¶¶ Includes outpatient care center (422), home health care service (317), and dental facility (65); free-text fields were used to create new categories. Discussion State, local, and territorial health departments voluntarily submit COVID-19 case notification data to CDC, and these critical data help provide a national picture of cases. The first report on HCP with COVID-19 using national case surveillance data in April 2020 ( 2 ) described characteristics of 9,282 HCP cases and 27 deaths among approximately 315,000 total cases. As of July 16, 2020, among approximately 2.5 million reported U.S. COVID-19 cases, 100,570 cases in HCP and 641 deaths among HCP with COVID-19 have been reported to CDC. Continued national surveillance is vital to evaluate the effect of the pandemic on HCP, and this update emphasizes the ongoing impact on this essential working population. Among reported HCP with COVID-19, age and sex distributions remain comparable to those of the overall U.S. HCP workforce §§ ; however, compared with nonfatal COVID-19 cases in HCP, fatal HCP cases were more common among older persons and males. Similar to findings described in the overall population ( 4 , 5 ), HCP with underlying medical conditions who developed COVID-19 were at increased risk for death. Almost all reported HCP with COVID-19 who died had at least one of 10 underlying conditions listed on the case report form, compared with fewer than one half of those who survived. Asian and Black HCP were also more prevalent among fatal cases; disproportionate mortality of persons from some racial and ethnic groups among cases has also been described in the general population ( 3 ). Long-standing inequities in social determinants of health can result in some groups being at increased risk for illness and death from COVID-19, and these factors must also be recognized and addressed when protecting essential workers in the workplace, at home, and in the community. Ensuring adequate allocation of PPE to all HCP in the workplace is one important approach to mitigating systemic inequalities in COVID-19 risk ( 6 ). As the COVID-19 pandemic continues in the United States, HCP are faced with increasing fatigue, demands, and stressors. HCP who are at higher risk for severe illness and death from COVID-19 should maintain ongoing communication with their personal health care providers and occupational health services to manage their risks at work and in the community. In this update, most HCP with COVID-19 were reported to work in nursing and residential care facilities. Large COVID-19 outbreaks in long-term care facilities suggest that transmission occurs among residents and staff members ( 7 , 8 ). During the COVID-19 pandemic, multiple challenges in long-term care settings have been identified, including inadequate staffing and PPE, and insufficient training in infection prevention and control. As the pandemic continues, it is essential to meet the health and safety needs of HCP serving populations requiring long-term care. Importantly, HCP cases were also identified from a variety of other health care settings. Therefore, increased access to resources, appropriate training, and ongoing support are needed across the health care spectrum to protect all HCP and their patients. HCP with COVID-19 were reported among a diverse range of occupations. Nurses represented 30% of HCP cases with known occupation type, but account for only approximately 15% of the total U.S. health care and social assistance workforce. ¶¶ Nurses and health care support workers often have frequent, close contact with patients and work in settings that might increase their risk for acquiring SARS-CoV-2, the virus that causes COVID-19. HCP who do not provide direct patient care, such as administrative staff members and environmental service workers, were also reported to have COVID-19. Risk to HCP can occur through pathways other than direct patient care, such as exposure to coworkers, household members, or persons in the community. HCP who acquire SARS-CoV-2 can similarly introduce the virus to patients, coworkers, or persons outside the workplace. Thus, practices such as universal use of face masks at work, wearing masks in the community, observing social distancing, and practicing good hand hygiene remain critical strategies to protect HCP and the populations they serve. Screening HCP for illness before workplace entry and providing nonpunitive sick leave options remain critical practices. The findings in this report are subject to at least five limitations. First, although reporting completeness increased from 16% in April to 22% in July ( 2 ), HCP status remains missing for most cases reported to CDC. HCP might be prioritized for testing, but the actual number of cases in this population is most certainly underreported and underdetected, especially in asymptomatic persons ( 9 , 10 ). Second, the amount of missing data varied across demographic groups, underlying medical conditions, and health outcomes; persons with known HCP status and other information might differ systematically from those for whom this information is not available. Third, details of HCP occupation type and job setting were not included on the CDC case report form until May 2020, and only six jurisdictions reported these data. Fourth, testing strategies and availability can vary by jurisdiction and health care setting, influencing the numbers and types of HCP cases detected. Finally, this report does not include information on whether exposure to SARS-CoV-2 among HCP cases occurred in the workplace or in other settings, such as the household or community. As of July 16, 2020, 100,570 COVID-19 cases in HCP and 641 deaths among HCP with COVID-19 were reported in the United States. Information on COVID-19 among essential workers, including HCP, can inform strategies needed to protect these populations and those they serve, including decisions related to COVID-19 vaccination, when available. Factors such as demographics, including race and ethnicity, underlying health conditions, occupation type, and job setting can contribute to the risk of HCP acquiring COVID-19 and experiencing severe outcomes, including death. Given the evidence of ongoing COVID-19 infections among HCP and the critical role these persons play in caring for others, continued protection of this population at work, at home, and in the community remains a national priority.*** Summary What is already known about this topic? Health care personnel (HCP) are essential workers at risk for COVID-19. What is added by this report? HCP with COVID-19 who died tended to be older, male, Asian, Black, and have an underlying medical condition when compared with HCP who did not die. Nursing and residential care facilities were the most commonly reported job setting and nursing the most common single occupation type of HCP with COVID-19 in six jurisdictions. What are the implications for public health practice? Continued surveillance is vital to understand the impact of COVID-19 on essential workers. Ensuring access to personal protective equipment and training, and practices such as universal use of face masks at work, wearing masks in the community, and observing social distancing remain critical strategies to protect HCP and those they serve.

          Related collections

          Most cited references9

          • Record: found
          • Abstract: found
          • Article: not found

          Presymptomatic SARS-CoV-2 Infections and Transmission in a Skilled Nursing Facility

          Abstract Background Severe acute respiratory syndrome coronavirus 2 (SARS-CoV-2) infection can spread rapidly within skilled nursing facilities. After identification of a case of Covid-19 in a skilled nursing facility, we assessed transmission and evaluated the adequacy of symptom-based screening to identify infections in residents. Methods We conducted two serial point-prevalence surveys, 1 week apart, in which assenting residents of the facility underwent nasopharyngeal and oropharyngeal testing for SARS-CoV-2, including real-time reverse-transcriptase polymerase chain reaction (rRT-PCR), viral culture, and sequencing. Symptoms that had been present during the preceding 14 days were recorded. Asymptomatic residents who tested positive were reassessed 7 days later. Residents with SARS-CoV-2 infection were categorized as symptomatic with typical symptoms (fever, cough, or shortness of breath), symptomatic with only atypical symptoms, presymptomatic, or asymptomatic. Results Twenty-three days after the first positive test result in a resident at this skilled nursing facility, 57 of 89 residents (64%) tested positive for SARS-CoV-2. Among 76 residents who participated in point-prevalence surveys, 48 (63%) tested positive. Of these 48 residents, 27 (56%) were asymptomatic at the time of testing; 24 subsequently developed symptoms (median time to onset, 4 days). Samples from these 24 presymptomatic residents had a median rRT-PCR cycle threshold value of 23.1, and viable virus was recovered from 17 residents. As of April 3, of the 57 residents with SARS-CoV-2 infection, 11 had been hospitalized (3 in the intensive care unit) and 15 had died (mortality, 26%). Of the 34 residents whose specimens were sequenced, 27 (79%) had sequences that fit into two clusters with a difference of one nucleotide. Conclusions Rapid and widespread transmission of SARS-CoV-2 was demonstrated in this skilled nursing facility. More than half of residents with positive test results were asymptomatic at the time of testing and most likely contributed to transmission. Infection-control strategies focused solely on symptomatic residents were not sufficient to prevent transmission after SARS-CoV-2 introduction into this facility.
            Bookmark
            • Record: found
            • Abstract: found
            • Article: found
            Is Open Access

            Hospitalization Rates and Characteristics of Patients Hospitalized with Laboratory-Confirmed Coronavirus Disease 2019 — COVID-NET, 14 States, March 1–30, 2020

            Since SARS-CoV-2, the novel coronavirus that causes coronavirus disease 2019 (COVID-19), was first detected in December 2019 ( 1 ), approximately 1.3 million cases have been reported worldwide ( 2 ), including approximately 330,000 in the United States ( 3 ). To conduct population-based surveillance for laboratory-confirmed COVID-19–associated hospitalizations in the United States, the COVID-19–Associated Hospitalization Surveillance Network (COVID-NET) was created using the existing infrastructure of the Influenza Hospitalization Surveillance Network (FluSurv-NET) ( 4 ) and the Respiratory Syncytial Virus Hospitalization Surveillance Network (RSV-NET). This report presents age-stratified COVID-19–associated hospitalization rates for patients admitted during March 1–28, 2020, and clinical data on patients admitted during March 1–30, 2020, the first month of U.S. surveillance. Among 1,482 patients hospitalized with COVID-19, 74.5% were aged ≥50 years, and 54.4% were male. The hospitalization rate among patients identified through COVID-NET during this 4-week period was 4.6 per 100,000 population. Rates were highest (13.8) among adults aged ≥65 years. Among 178 (12%) adult patients with data on underlying conditions as of March 30, 2020, 89.3% had one or more underlying conditions; the most common were hypertension (49.7%), obesity (48.3%), chronic lung disease (34.6%), diabetes mellitus (28.3%), and cardiovascular disease (27.8%). These findings suggest that older adults have elevated rates of COVID-19–associated hospitalization and the majority of persons hospitalized with COVID-19 have underlying medical conditions. These findings underscore the importance of preventive measures (e.g., social distancing, respiratory hygiene, and wearing face coverings in public settings where social distancing measures are difficult to maintain) † to protect older adults and persons with underlying medical conditions, as well as the general public. In addition, older adults and persons with serious underlying medical conditions should avoid contact with persons who are ill and immediately contact their health care provider(s) if they have symptoms consistent with COVID-19 (https://www.cdc.gov/coronavirus/2019-ncov/symptoms-testing/symptoms.html) ( 5 ). Ongoing monitoring of hospitalization rates, clinical characteristics, and outcomes of hospitalized patients will be important to better understand the evolving epidemiology of COVID-19 in the United States and the clinical spectrum of disease, and to help guide planning and prioritization of health care system resources. COVID-NET conducts population-based surveillance for laboratory-confirmed COVID-19–associated hospitalizations among persons of all ages in 99 counties in 14 states (California, Colorado, Connecticut, Georgia, Iowa, Maryland, Michigan, Minnesota, New Mexico, New York, Ohio, Oregon, Tennessee, and Utah), distributed across all 10 U.S Department of Health and Human Services regions. § The catchment area represents approximately 10% of the U.S. population. Patients must be residents of a designated COVID-NET catchment area and hospitalized within 14 days of a positive SARS-CoV-2 test to meet the surveillance case definition. Testing is requested at the discretion of treating health care providers. Laboratory-confirmed SARS-CoV-2 is defined as a positive result by any test that has received Emergency Use Authorization for SARS-CoV-2 testing. ¶ COVID-NET surveillance officers in each state identify cases through active review of notifiable disease and laboratory databases and hospital admission and infection control practitioner logs. Weekly age-stratified hospitalization rates are estimated using the number of catchment area residents hospitalized with laboratory-confirmed COVID-19 as the numerator and National Center for Health Statistics vintage 2018 bridged-race postcensal population estimates for the denominator.** As of April 3, 2020, COVID-NET hospitalization rates are being published each week at https://gis.cdc.gov/grasp/covidnet/COVID19_3.html. For each case, trained surveillance officers conduct medical chart abstractions using a standard case report form to collect data on patient characteristics, underlying medical conditions, clinical course, and outcomes. Chart reviews are finalized once patients have a discharge disposition. COVID-NET surveillance was initiated on March 23, 2020, with retrospective case identification of patients admitted during March 1–22, 2020, and prospective case identification during March 23–30, 2020. Clinical data on underlying conditions and symptoms at admission are presented through March 30; hospitalization rates are updated weekly and, therefore, are presented through March 28 (epidemiologic week 13). The COVID-19–associated hospitalization rate among patients identified through COVID-NET for the 4-week period ending March 28, 2020, was 4.6 per 100,000 population (Figure 1). Hospitalization rates increased with age, with a rate of 0.3 in persons aged 0–4 years, 0.1 in those aged 5–17 years, 2.5 in those aged 18–49 years, 7.4 in those aged 50–64 years, and 13.8 in those aged ≥65 years. Rates were highest among persons aged ≥65 years, ranging from 12.2 in those aged 65–74 years to 17.2 in those aged ≥85 years. More than half (805; 54.4%) of hospitalizations occurred among men; COVID-19-associated hospitalization rates were higher among males than among females (5.1 versus 4.1 per 100,000 population). Among the 1,482 laboratory-confirmed COVID-19–associated hospitalizations reported through COVID-NET, six (0.4%) each were patients aged 0–4 years and 5–17 years, 366 (24.7%) were aged 18–49 years, 461 (31.1%) were aged 50–64 years, and 643 (43.4%) were aged ≥65 years. Among patients with race/ethnicity data (580), 261 (45.0%) were non-Hispanic white (white), 192 (33.1%) were non-Hispanic black (black), 47 (8.1%) were Hispanic, 32 (5.5%) were Asian, two (0.3%) were American Indian/Alaskan Native, and 46 (7.9%) were of other or unknown race. Rates varied widely by COVID-NET surveillance site (Figure 2). FIGURE 1 Laboratory-confirmed coronavirus disease 2019 (COVID-19)–associated hospitalization rates,* by age group — COVID-NET, 14 states, † March 1–28, 2020 Abbreviation: COVID-NET = Coronavirus Disease 2019–Associated Hospitalization Surveillance Network. * Number of patients hospitalized with COVID-19 per 100,000 population. † Counties included in COVID-NET surveillance: California (Alameda, Contra Costa, and San Francisco counties); Colorado (Adams, Arapahoe, Denver, Douglas, and Jefferson counties); Connecticut (New Haven and Middlesex counties); Georgia (Clayton, Cobb, DeKalb, Douglas, Fulton, Gwinnett, Newton, and Rockdale counties); Iowa (one county represented); Maryland (Allegany, Anne Arundel, Baltimore, Baltimore City, Calvert, Caroline, Carroll, Cecil, Charles, Dorchester, Frederick, Garrett, Harford, Howard, Kent, Montgomery, Prince George’s, Queen Anne’s, St. Mary’s, Somerset, Talbot, Washington, Wicomico, and Worcester counties); Michigan (Clinton, Eaton, Genesee, Ingham, and Washtenaw counties); Minnesota (Anoka, Carver, Dakota, Hennepin, Ramsey, Scott, and Washington counties); New Mexico (Bernalillo, Chaves, Dona Ana, Grant, Luna, San Juan, and Santa Fe counties); New York (Albany, Columbia, Genesee, Greene, Livingston, Monroe, Montgomery, Ontario, Orleans, Rensselaer, Saratoga, Schenectady, Schoharie, Wayne, and Yates counties); Ohio (Delaware, Fairfield, Franklin, Hocking, Licking, Madison, Morrow, Perry, Pickaway and Union counties); Oregon (Clackamas, Multnomah, and Washington counties); Tennessee (Cheatham, Davidson, Dickson, Robertson, Rutherford, Sumner, Williamson, and Wilson counties); and Utah (Salt Lake County). The figure is a bar chart showing laboratory-confirmed COVID-19–associated hospitalization rates, by age group, in 14 states during March 1–28, 2020 according to the Coronavirus Disease 2019–Associated Hospitalization Surveillance Network. FIGURE 2 Laboratory-confirmed coronavirus disease 2019 (COVID-19)–associated hospitalization rates,* by surveillance site † — COVID-NET, 14 states, March 1–28, 2020 Abbreviation: COVID-NET = Coronavirus Disease 2019–Associated Hospitalization Surveillance Network. * Number of patients hospitalized with COVID-19 per 100,000 population. † Counties included in COVID-NET surveillance: California (Alameda, Contra Costa, and San Francisco counties); Colorado (Adams, Arapahoe, Denver, Douglas, and Jefferson counties); Connecticut (New Haven and Middlesex counties); Georgia (Clayton, Cobb, DeKalb, Douglas, Fulton, Gwinnett, Newton, and Rockdale counties); Iowa (one county represented); Maryland (Allegany, Anne Arundel, Baltimore, Baltimore City, Calvert, Caroline, Carroll, Cecil, Charles, Dorchester, Frederick, Garrett, Harford, Howard, Kent, Montgomery, Prince George’s, Queen Anne’s, St. Mary’s, Somerset, Talbot, Washington, Wicomico, and Worcester counties); Michigan (Clinton, Eaton, Genesee, Ingham, and Washtenaw counties); Minnesota (Anoka, Carver, Dakota, Hennepin, Ramsey, Scott, and Washington counties); New Mexico (Bernalillo, Chaves, Dona Ana, Grant, Luna, San Juan, and Santa Fe counties); New York (Albany, Columbia, Genesee, Greene, Livingston, Monroe, Montgomery, Ontario, Orleans, Rensselaer, Saratoga, Schenectady, Schoharie, Wayne, and Yates counties); Ohio (Delaware, Fairfield, Franklin, Hocking, Licking, Madison, Morrow, Perry, Pickaway and Union counties); Oregon (Clackamas, Multnomah, and Washington counties); Tennessee (Cheatham, Davidson, Dickson, Robertson, Rutherford, Sumner, Williamson, and Wilson counties); and Utah (Salt Lake County). The figure is a bar chart showing laboratory-confirmed COVID-19–associated hospitalization rates, by surveillance site, in 14 states during March 1–28, 2020 according to the Coronavirus Disease 2019–Associated Hospitalization Surveillance Network. During March 1–30, underlying medical conditions and symptoms at admission were reported through COVID-NET for approximately 180 (12.1%) hospitalized adults (Table); 89.3% had one or more underlying conditions. The most commonly reported were hypertension (49.7%), obesity (48.3%), chronic lung disease (34.6%), diabetes mellitus (28.3%), and cardiovascular disease (27.8%). Among patients aged 18–49 years, obesity was the most prevalent underlying condition, followed by chronic lung disease (primarily asthma) and diabetes mellitus. Among patients aged 50–64 years, obesity was most prevalent, followed by hypertension and diabetes mellitus; and among those aged ≥65 years, hypertension was most prevalent, followed by cardiovascular disease and diabetes mellitus. Among 33 females aged 15–49 years hospitalized with COVID-19, three (9.1%) were pregnant. Among 167 patients with available data, the median interval from symptom onset to admission was 7 days (interquartile range [IQR] = 3–9 days). The most common signs and symptoms at admission included cough (86.1%), fever or chills (85.0%), and shortness of breath (80.0%). Gastrointestinal symptoms were also common; 26.7% had diarrhea, and 24.4% had nausea or vomiting. TABLE Underlying conditions and symptoms among adults aged ≥18 years with coronavirus disease 2019 (COVID-19)–associated hospitalizations — COVID-NET, 14 states,* March 1–30, 2020† Underlying condition Age group (yrs), no./total no. (%) Overall 18–49 50–64 ≥65 years Any underlying condition 159/178 (89.3) 41/48 (85.4) 51/59 (86.4) 67/71 (94.4) Hypertension 79/159 (49.7) 7/40 (17.5) 27/57 (47.4) 45/62 (72.6) Obesity§ 73/151 (48.3) 23/39 (59.0) 25/51 (49.0) 25/61 (41.0) Chronic metabolic disease¶ 60/166 (36.1) 10/46 (21.7) 21/56 (37.5) 29/64 (45.3)    Diabetes mellitus 47/166 (28.3) 9/46 (19.6) 18/56 (32.1) 20/64 (31.3) Chronic lung disease 55/159 (34.6) 16/44 (36.4) 15/53 (28.3) 24/62 (38.7)    Asthma 27/159 (17.0) 12/44 (27.3) 7/53 (13.2) 8/62 (12.9)    Chronic obstructive pulmonary disease 17/159 (10.7) 0/44 (0.0) 3/53 (5.7) 14/62 (22.6) Cardiovascular disease** 45/162 (27.8) 2/43 (4.7) 11/56 (19.6) 32/63 (50.8)    Coronary artery disease 23/162 (14.2) 0/43 (0.0) 7/56 (12.5) 16/63 (25.4)    Congestive heart failure 11/162 (6.8) 2/43 (4.7) 3/56 (5.4) 6/63 (9.5) Neurologic disease 22/157 (14.0) 4/42 (9.5) 4/55 (7.3) 14/60 (23.3) Renal disease 20/153 (13.1) 3/41 (7.3) 2/53 (3.8) 15/59 (25.4) Immunosuppressive condition 15/156 (9.6) 5/43 (11.6) 4/54 (7.4) 6/59 (10.2) Gastrointestinal/Liver disease 10/152 (6.6) 4/42 (9.5) 0/54 (0.0) 6/56 (10.7) Blood disorder 9/156 (5.8) 1/43 (2.3) 1/55 (1.8) 7/58 (12.1) Rheumatologic/Autoimmune disease 3/154 (1.9) 1/42 (2.4) 0/54 (0.0) 2/58 (3.4) Pregnancy†† 3/33 (9.1) 3/33 (9.1) N/A N/A Symptom §§ Cough 155/180 (86.1) 43/47 (91.5) 54/60 (90.0) 58/73 (79.5) Fever/Chills 153/180 (85.0) 38/47 (80.9) 53/60 (88.3) 62/73 (84.9) Shortness of breath 144/180 (80.0) 40/47 (85.1) 50/60 (83.3) 54/73 (74.0) Myalgia 62/180 (34.4) 20/47 (42.6) 23/60 (38.3) 19/73 (26.0) Diarrhea 48/180 (26.7) 10/47 (21.3) 17/60 (28.3) 21/73 (28.8) Nausea/Vomiting 44/180 (24.4) 12/47 (25.5) 17/60 (28.3) 15/73 (20.5) Sore throat 32/180 (17.8) 8/47 (17.0) 13/60 (21.7) 11/73 (15.1) Headache 29/180 (16.1) 10/47 (21.3) 12/60 (20.0) 7/73 (9.6) Nasal congestion/Rhinorrhea 29/180 (16.1) 8/47 (17.0) 13/60 (21.7) 8/73 (11.0) Chest pain 27/180 (15.0) 9/47 (19.1) 13/60 (21.7) 5/73 (6.8) Abdominal pain 15/180 (8.3) 6/47 (12.8) 6/60 (10.0) 3/73 (4.1) Wheezing 12/180 (6.7) 3/47 (6.4) 2/60 (3.3) 7/73 (9.6) Altered mental status/Confusion 11/180 (6.1) 3/47 (6.4) 2/60 (3.3) 6/73 (8.2) Abbreviations: COVID-NET = Coronavirus Disease 2019–Associated Hospitalization Surveillance Network; N/A = not applicable. * Counties included in COVID-NET surveillance: California (Alameda, Contra Costa, and San Francisco counties); Colorado (Adams, Arapahoe, Denver, Douglas, and Jefferson counties); Connecticut (New Haven and Middlesex counties); Georgia (Clayton, Cobb, DeKalb, Douglas, Fulton, Gwinnett, Newton, and Rockdale counties); Iowa (one county represented); Maryland (Allegany, Anne Arundel, Baltimore, Baltimore City, Calvert, Caroline, Carroll, Cecil, Charles, Dorchester, Frederick, Garrett, Harford, Howard, Kent, Montgomery, Prince George’s, Queen Anne’s, St. Mary’s, Somerset, Talbot, Washington, Wicomico, and Worcester counties); Michigan (Clinton, Eaton, Genesee, Ingham, and Washtenaw counties); Minnesota (Anoka, Carver, Dakota, Hennepin, Ramsey, Scott, and Washington counties); New Mexico (Bernalillo, Chaves, Dona Ana, Grant, Luna, San Juan, and Santa Fe counties); New York (Albany, Columbia, Genesee, Greene, Livingston, Monroe, Montgomery, Ontario, Orleans, Rensselaer, Saratoga, Schenectady, Schoharie, Wayne, and Yates counties); Ohio (Delaware, Fairfield, Franklin, Hocking, Licking, Madison, Morrow, Perry, Pickaway and Union counties); Oregon (Clackamas, Multnomah, and Washington counties); Tennessee (Cheatham, Davidson, Dickson, Robertson, Rutherford, Sumner, Williamson, and Wilson counties); and Utah (Salt Lake County). † COVID-NET included data for one child aged 5–17 years with underlying medical conditions and symptoms at admission; data for this child are not included in this table. This child was reported to have chronic lung disease (asthma). Symptoms included fever, cough, gastrointestinal symptoms, shortness of breath, chest pain, and a sore throat on admission. § Obesity is defined as calculated body mass index (BMI) ≥30 kg/m2, and if BMI is missing, by International Classification of Diseases discharge diagnosis codes. Among 73 patients with obesity, 51 (69.9%) had obesity defined as BMI 30–<40 kg/m2, and 22 (30.1%) had severe obesity defined as BMI ≥40 kg/m2. ¶ Among the 60 patients with chronic metabolic disease, 45 had diabetes mellitus only, 13 had thyroid dysfunction only, and two had diabetes mellitus and thyroid dysfunction. ** Cardiovascular disease excludes hypertension. †† Restricted to women aged 15–49 years. §§ Symptoms were collected through review of admission history and physical exam notes in the medical record and might be determined by subjective or objective findings. In addition to the symptoms in the table, the following less commonly reported symptoms were also noted for adults with information on symptoms (180): hemoptysis/bloody sputum (2.2%), rash (1.1%), conjunctivitis (0.6%), and seizure (0.6%). Discussion During March 1–28, 2020, the overall laboratory-confirmed COVID-19–associated hospitalization rate was 4.6 per 100,000 population; rates increased with age, with the highest rates among adults aged ≥65 years. Approximately 90% of hospitalized patients identified through COVID-NET had one or more underlying conditions, the most common being obesity, hypertension, chronic lung disease, diabetes mellitus, and cardiovascular disease. Using the existing infrastructure of two respiratory virus surveillance platforms, COVID-NET was implemented to produce robust, weekly, age-stratified hospitalization rates using standardized data collection methods. These data are being used, along with data from other surveillance platforms (https://www.cdc.gov/coronavirus/2019-ncov/covid-data/covidview.html), to monitor COVID-19 disease activity and severity in the United States. During the first month of surveillance, COVID-NET hospitalization rates ranged from 0.1 per 100,000 population in persons aged 5–17 years to 17.2 per 100,000 population in adults aged ≥85 years, whereas cumulative influenza hospitalization rates during the first 4 weeks of each influenza season (epidemiologic weeks 40–43) over the past 5 seasons have ranged from 0.1 in persons aged 5–17 years to 2.2–5.4 in adults aged ≥85 years ( 6 ). COVID-NET rates during this first 4-week period of surveillance are preliminary and should be interpreted with caution; given the rapidly evolving nature of the COVID-19 pandemic, rates are expected to increase as additional cases are identified and as SARS-CoV-2 testing capacity in the United States increases. In the COVID-NET catchment population, approximately 49% of residents are male and 51% of residents are female, whereas 54% of COVID-19-associated hospitalizations occurred in males and 46% occurred in females. These data suggest that males may be disproportionately affected by COVID-19 compared with females. Similarly, in the COVID-NET catchment population, approximately 59% of residents are white, 18% are black, and 14% are Hispanic; however, among 580 hospitalized COVID-19 patients with race/ethnicity data, approximately 45% were white, 33% were black, and 8% were Hispanic, suggesting that black populations might be disproportionately affected by COVID-19. These findings, including the potential impact of both sex and race on COVID-19-associated hospitalization rates, need to be confirmed with additional data. Most of the hospitalized patients had underlying conditions, some of which are recognized to be associated with severe COVID-19 disease, including chronic lung disease, cardiovascular disease, diabetes mellitus ( 5 ). COVID-NET does not collect data on nonhospitalized patients; thus, it was not possible to compare the prevalence of underlying conditions in hospitalized versus nonhospitalized patients. Many of the documented underlying conditions among hospitalized COVID-19 patients are highly prevalent in the United States. According to data from the National Health and Nutrition Examination Survey, hypertension prevalence among U.S. adults is 29% overall, ranging from 7.5%–63% across age groups ( 7 ), and age-adjusted obesity prevalence is 42% (range across age groups = 40%–43%) ( 8 ). Among hospitalized COVID-19 patients, hypertension prevalence was 50% (range across age groups = 18%–73%), and obesity prevalence was 48% (range across age groups = 41%–59%). In addition, the prevalences of several underlying conditions identified through COVID-NET were similar to those for hospitalized influenza patients identified through FluSurv-NET during influenza seasons 2014–15 through 2018–19: 41%–51% of patients had cardiovascular disease (excluding hypertension), 39%–45% had chronic metabolic disease, 33%–40% had obesity, and 29%–31% had chronic lung disease ( 6 ). Data on hypertension are not collected by FluSurv-NET. Among women aged 15–49 years hospitalized with COVID-19 and identified through COVID-NET, 9% were pregnant, which is similar to an estimated 9.9% of the general population of women aged 15–44 years who are pregnant at any given time based on 2010 data. †† Similar to other reports from the United States ( 9 ) and China ( 1 ), these findings indicate that a high proportion of U.S. patients hospitalized with COVID-19 are older and have underlying medical conditions. The findings in this report are subject to at least three limitations. First, hospitalization rates by age and COVID-NET site are preliminary and might change as additional cases are identified from this surveillance period. Second, whereas minimum case data to produce weekly age-stratified hospitalization rates are usually available within 7 days of case identification, availability of detailed clinical data are delayed because of the need for medical chart abstractions. As of March 30, chart abstractions had been conducted for approximately 200 COVID-19 patients; the frequency and distribution of underlying conditions during this time might change as additional data become available. Clinical course and outcomes will be presented once the number of cases with complete medical chart abstractions are sufficient; many patients are still hospitalized at the time of this report. Finally, testing for SARS-CoV-2 among patients identified through COVID-NET is performed at the discretion of treating health care providers, and testing practices and capabilities might vary widely across providers and facilities. As a result, underascertainment of cases in COVID-NET is likely. Additional data on testing practices related to SARS-CoV-2 will be collected in the future to account for underascertainment using described methods ( 10 ). Early data from COVID-NET suggest that COVID-19–associated hospitalizations in the United States are highest among older adults, and nearly 90% of persons hospitalized have one or more underlying medical conditions. These findings underscore the importance of preventive measures (e.g., social distancing, respiratory hygiene, and wearing face coverings in public settings where social distancing measures are difficult to maintain) to protect older adults and persons with underlying medical conditions. Ongoing monitoring of hospitalization rates, clinical characteristics, and outcomes of hospitalized patients will be important to better understand the evolving epidemiology of COVID-19 in the United States and the clinical spectrum of disease, and to help guide planning and prioritization of health care system resources. Summary What is already known about this topic? Population-based rates of laboratory-confirmed coronavirus disease 2019 (COVID-19)–associated hospitalizations are lacking in the United States. What is added by this report? COVID-NET was implemented to produce robust, weekly, age-stratified COVID-19–associated hospitalization rates. Hospitalization rates increase with age and are highest among older adults; the majority of hospitalized patients have underlying conditions. What are the implications for public health practice? Strategies to prevent COVID-19, including social distancing, respiratory hygiene, and face coverings in public settings where social distancing measures are difficult to maintain, are particularly important to protect older adults and those with underlying conditions. Ongoing monitoring of hospitalization rates is critical to understanding the evolving epidemiology of COVID-19 in the United States and to guide planning and prioritization of health care resources.
              Bookmark
              • Record: found
              • Abstract: found
              • Article: found
              Is Open Access

              Risk of COVID-19 among front-line health-care workers and the general community: a prospective cohort study

              Summary Background Data for front-line health-care workers and risk of COVID-19 are limited. We sought to assess risk of COVID-19 among front-line health-care workers compared with the general community and the effect of personal protective equipment (PPE) on risk. Methods We did a prospective, observational cohort study in the UK and the USA of the general community, including front-line health-care workers, using self-reported data from the COVID Symptom Study smartphone application (app) from March 24 (UK) and March 29 (USA) to April 23, 2020. Participants were voluntary users of the app and at first use provided information on demographic factors (including age, sex, race or ethnic background, height and weight, and occupation) and medical history, and subsequently reported any COVID-19 symptoms. We used Cox proportional hazards modelling to estimate multivariate-adjusted hazard ratios (HRs) of our primary outcome, which was a positive COVID-19 test. The COVID Symptom Study app is registered with ClinicalTrials.gov, NCT04331509. Findings Among 2 035 395 community individuals and 99 795 front-line health-care workers, we recorded 5545 incident reports of a positive COVID-19 test over 34 435 272 person-days. Compared with the general community, front-line health-care workers were at increased risk for reporting a positive COVID-19 test (adjusted HR 11·61, 95% CI 10·93–12·33). To account for differences in testing frequency between front-line health-care workers and the general community and possible selection bias, an inverse probability-weighted model was used to adjust for the likelihood of receiving a COVID-19 test (adjusted HR 3·40, 95% CI 3·37–3·43). Secondary and post-hoc analyses suggested adequacy of PPE, clinical setting, and ethnic background were also important factors. Interpretation In the UK and the USA, risk of reporting a positive test for COVID-19 was increased among front-line health-care workers. Health-care systems should ensure adequate availability of PPE and develop additional strategies to protect health-care workers from COVID-19, particularly those from Black, Asian, and minority ethnic backgrounds. Additional follow-up of these observational findings is needed. Funding Zoe Global, Wellcome Trust, Engineering and Physical Sciences Research Council, National Institutes of Health Research, UK Research and Innovation, Alzheimer's Society, National Institutes of Health, National Institute for Occupational Safety and Health, and Massachusetts Consortium on Pathogen Readiness.
                Bookmark

                Author and article information

                Journal
                MMWR Morb Mortal Wkly Rep
                MMWR Morb Mortal Wkly Rep
                WR
                Morbidity and Mortality Weekly Report
                Centers for Disease Control and Prevention
                0149-2195
                1545-861X
                25 September 2020
                25 September 2020
                : 69
                : 38
                : 1364-1368
                Affiliations
                CDC COVID-19 Response Team; New Jersey Department of Health; New York City Department of Health and Mental Hygiene; Michigan Department of Health and Human Services.
                Author notes
                Corresponding author: Michelle M. Hughes for the CDC COVID-19 Response Team, eocevent294@ 123456cdc.gov .
                Article
                mm6938a3
                10.15585/mmwr.mm6938a3
                7727493
                32970661
                264898fc-d7bc-49fe-948d-6d6086016e26

                All material in the MMWR Series is in the public domain and may be used and reprinted without permission; citation as to source, however, is appreciated.

                History
                Categories
                Full Report

                Comments

                Comment on this article