67
views
0
recommends
+1 Recommend
2 collections
    0
    shares
      • Record: found
      • Abstract: found
      • Article: found
      Is Open Access

      Birth and Infant Outcomes Following Laboratory-Confirmed SARS-CoV-2 Infection in Pregnancy — SET-NET, 16 Jurisdictions, March 29–October 14, 2020

      research-article
      , MD 1 , , , PhD 1 , , MPH 1 , , MPH 1 , , MD 1 , , MD 1 , , MPH 2 , , PhD 3 , , PhD 4 , , MPH 5 , , MPH 6 , , MS 7 , , MPH 8 , , MA 9 , , MPH 10 , , MD 11 , , MD 12 , , DrPH 13 , , MPH 14 , , MPH 15 , , MD 16 , , MD 17 , , DVM 1 , , MD 1 , , PhD 1 , , PhD 1 , , MPH 1 , CDC COVID-19 Response Pregnancy and Infant Linked Outcomes Team COVID-19 Pregnancy and Infant Linked Outcomes Team (PILOT) COVID-19 Pregnancy and Infant Linked Outcomes Team (PILOT) , , , , , , , , , , , , , , , , , , , , , , , , , , , ,
      Morbidity and Mortality Weekly Report
      Centers for Disease Control and Prevention

      Read this article at

      Bookmark
          There is no author summary for this article yet. Authors can add summaries to their articles on ScienceOpen to make them more accessible to a non-specialist audience.

          Abstract

          On November 2, 2020, this report was posted online as an MMWR Early Release. Pregnant women with coronavirus disease 2019 (COVID-19) are at increased risk for severe illness and might be at risk for preterm birth ( 1 – 3 ). The full impact of infection with SARS-CoV-2, the virus that causes COVID-19, in pregnancy is unknown. Public health jurisdictions report information, including pregnancy status, on confirmed and probable COVID-19 cases to CDC through the National Notifiable Diseases Surveillance System.* Through the Surveillance for Emerging Threats to Mothers and Babies Network (SET-NET), 16 jurisdictions collected supplementary information on pregnancy and infant outcomes among 5,252 women with laboratory-confirmed SARS-CoV-2 infection reported during March 29–October 14, 2020. Among 3,912 live births with known gestational age, 12.9% were preterm (<37 weeks), higher than the reported 10.2% among the general U.S. population in 2019 ( 4 ). Among 610 infants (21.3%) with reported SARS-CoV-2 test results, perinatal infection was infrequent (2.6%) and occurred primarily among infants whose mother had SARS-CoV-2 infection identified within 1 week of delivery. Because the majority of pregnant women with COVID-19 reported thus far experienced infection in the third trimester, ongoing surveillance is needed to assess effects of infections in early pregnancy, as well the longer-term outcomes of exposed infants. These findings can inform neonatal testing recommendations, clinical practice, and public health action and can be used by health care providers to counsel pregnant women on the risks of SARS-CoV-2 infection, including preterm births. Pregnant women and their household members should follow recommended infection prevention measures, including wearing a mask, social distancing, and frequent handwashing when going out or interacting with others or if there is a person within the household who has had exposure to COVID-19. † SET-NET conducts longitudinal surveillance of pregnant women and their infants to understand the effects of emerging and reemerging threats. § Supplementary pregnancy-related information is reported for women with SARS-CoV-2 infection (based on detection of SARS-CoV-2 in a clinical specimen by molecular amplification detection testing ¶ ) during pregnancy through the day of delivery. As of October 14, 2020, 16 jurisdictions** have contributed data. Pregnancy status was ascertained through routine COVID-19 case surveillance or through matching of reported cases with other sources (e.g., vital records, administrative data) to identify or confirm pregnancy status. Data were abstracted using standard forms †† ; sources include routine public health investigations, vital records, laboratory reports, and medical records. Chi-squared tests were performed to test for statistically significant (p<0.05) differences in proportion of outcomes between women reported to have symptomatic infection and those reported to have asymptomatic infection using SAS (version 9.4; SAS Institute). This activity was reviewed by CDC and was conducted consistent with applicable federal law and CDC policy. §§ Jurisdictions reported 5,252 pregnant women with SARS-CoV-2 infection. Among these women, 309 (5.9%) were presumed to have ongoing pregnancies (no outcome reported and not past their estimated due date plus 90 days for reporting lag), and 501 (9.5%) did not have pregnancy outcomes reported and were either missing an estimated due date or presumed lost to follow-up. This report focuses on the 4,442 women with known pregnancy outcomes (84.6% of 5,252 women). 
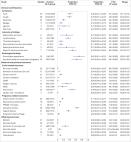
The median age of women was 28.9 years, and 46.0% were Hispanic or Latina (Hispanic) ethnicity (Table 1). At least one underlying medical condition was reported for 1,564 (45.1%) women, with prepregnancy obesity (body mass index ≥30 kg/m2) (35.1%) being the most commonly reported. Most (84.4%) women had infection identified in the third trimester (based on date of first positive test result or symptom onset). Symptom status was known for 2,691 (60.6%) women, 376 (14.0%) of whom were reported to be asymptomatic. TABLE 1 Demographics, underlying medical conditions, and SARS-CoV-2 infection characteristics of pregnant women with known pregnancy outcomes, by symptom status — SET-NET, 16 jurisdictions, March 29–October 14, 2020 Characteristic No. of women (%)[Total no. of women with available information] Total With symptomatic* infection With asymptomatic infection Unknown symptom status N = 4,442 (100.0) N = 2,315 (52.1) N = 376 (8.5) N = 1,751 (39.4) Age group, yrs [3,097] [1,883] [298] [916] Median (IQR) 28.9 (24.4–34.0) 30.0 (24.7–34.0) 28.0 (24.2–33.7) 30.0 (24.2–34.0) <20 167 (5.4) 97 (5.2) 26 (8.7) 44 (4.8) 20–24 654 (21.1) 390 (20.7) 63 (21.1) 201 (21.9) 25–29 735 (23.7) 454 (24.1) 74 (24.8) 207 (22.6) 30–34 870 (28.1) 530 (28.1) 75 (25.2) 265 (28.9) 35–39 525 (17.0) 326 (17.3) 46 (15.4) 153 (16.7) ≥40 146 (4.7) 86 (4.6) 14 (4.7) 46 (5.0) Race/Ethnicity [3,523] [2,026] [308] [1,189] Hispanic or Latina 1,622 (46.0) 876 (43.2) 138 (44.8) 608 (51.1) Asian, non-Hispanic 122 (3.5) 78 (3.8) 5 (1.6) 39 (3.3) Black, non-Hispanic 741 (21.0) 410 (20.2) 80 (26.0) 251 (21.1) White, non-Hispanic 914 (25.9) 592 (29.2) 78 (25.3) 244 (20.5) Multiple or other race, non-Hispanic 124 (3.5) 70 (3.5) 7 (2.3) 47 (4.0) Health insurance† [2,697] [1,363] [289] [1,045] Private 1,074 (39.8) 613 (45.0) 124 (42.9) 337 (32.2) Medicaid 1,442 (53.5) 645 (47.3) 146 (50.5) 651 (62.3) Other 80 (3.0) 39 (2.9) 10 (3.5) 31 (3.0) Self-pay/None 101 (3.7) 66 (4.8) 9 (3.1) 26 (2.5) Underlying medical conditions [3,471] [1,998] [322] [1,151] Any underlying condition§ 1,564 (45.1) 902 (45.1) 135 (41.9) 527 (45.8) Cardiovascular disease 35 (1.0) 31 (1.6) 3 (0.9) 1 (0.1) Chronic hypertension 55 (1.6) 30 (1.5) 10 (3.1) 15 (1.3) Chronic lung disease 100 (2.9) 85 (4.3) 10 (3.1) 5 (0.4) Diabetes mellitus¶ 74 (2.1) 56 (2.8) 7 (2.2) 11 (1.0) Immunosuppression 23 (0.7) 16 (0.8) 4 (1.2) 3 (0.3) Obesity (BMI ≥30 kg/m2) 1,217 (35.1) 684 (34.2) 97 (30.1) 436 (37.9) Other** 26 (0.7) 22 (1.1) 3 (0.9) 1 (0.1) Pregnancy related complications†† [2,794] [1,673] [270] [851] Pregnancy induced hypertension 211 (7.6) 124 (7.4) 24 (8.9) 63 (7.4) Gestational diabetes mellitus 228 (8.2) 141 (8.4) 21 (7.8) 66 (7.8) Trimester of SARS-CoV-2 infection§§ [3,309] [2,031] [295] [983] First trimester (<14 wks) 13 (0.4) 11 (0.5) 1 (0.3) 1 (0.1) Second trimester (14–27 wks) 502 (15.2) 347 (17.1) 24 (8.1) 131 (13.3) Third trimester (≥28 wks) 2,794 (84.4) 1,673 (82.4) 270 (91.5) 851 (86.6) Abbreviations: BMI = body mass index; COVID-19 = coronavirus disease 2019. *Inclusive of women reported as symptomatic on the COVID-19 case report form (https://www.cdc.gov/coronavirus/2019-ncov/php/reporting-pui.html) or who had any symptoms reported on the COVID-19 case report form regardless of completion of the symptom status variable. † Latest known insurance during pregnancy or at delivery. § Includes all listed for all women, and gestational diabetes mellitus and pregnancy induced hypertension for women with infection identified in the third trimester. Pregnancy itself is not considered an underlying condition. ¶ Includes either type 1 or type 2 diabetes, does not include gestational diabetes. ** Other conditions include neurologic conditions or disabilities, chronic renal disease, chronic liver disease, psychiatric disorders, and autoimmune disorders. †† Among women with SARS-CoV-2 infection in third trimester. §§ Calculated as either date of specimen collection for first positive test, or symptom onset if exact date of specimen collection was missing. Among 4,527 fetuses and infants, the outcomes comprised 4,495 (99.3%) live births (including 79 sets of twins and one set of triplets), 12 (0.3%) pregnancy losses at <20 weeks’ gestation, and 20 (0.4%) losses at ≥20 weeks’ gestation (Table 2). Among 3,912 infants with reported gestational age, 506 (12.9%) were preterm, including 149 (3.8%) at <34 weeks and 357 (9.1%) at 34–37 weeks. Frequency of preterm birth did not differ by maternal symptom status (p = 0.62), including among women hospitalized at the time of infection (p = 0.81, Fisher’s exact test). Among 3,486 (77.6%) live births with weight, gestational age, and sex reported, 198 (5.7%) were small for gestational age. ¶¶ Twenty-eight (0.6%) infants were reported to have any birth defect; among 23 infants for whom timing of maternal SARS-CoV-2 infection during pregnancy was known, 17 (74%) were born to mothers with infection identified in the third trimester. Nine (0.2%) in-hospital neonatal deaths were reported. Among term infants (≥37 weeks’ gestation), 9.3% were admitted to an intensive care unit (ICU); however, reason for admission was often missing. TABLE 2 Pregnancy and birth outcomes among pregnant women with laboratory-confirmed SARS-CoV-2 infection by symptom status* — SET-NET, 16 jurisdictions, March 29–October 14, 2020 Characteristic No. of outcomes (%)[Total no. of women with available information] Total Women with symptomatic infection† Women with asymptomatic infection Women with no symptom status reported N = 4,442 N = 2,315 (52.1) N = 376 (8.5) N = 1,751 (39.4) Days from first positive RT-PCR test to pregnancy outcome [3,278] [2,104] [278] [894] Median (IQR) 17.5 (1–58) 23 (3–61) 1 (0–12) 12 (1–58) Induction of labor [3,846] [2,113] [264] [1,469] Induced 1,091 (28.4) 593 (28.1) 78 (29.5) 420 (28.6) Delivery type [3,920] [2,145] [285] [1,490] Vaginal 2,589 (66.0) 1,403 (65.4) 195 (68.4) 991 (66.5) Cesarean 1,331 (34.0) 742 (34.6) 90 (31.6) 499 (33.5) Emergent 110 (39.6) 72 (42.6) 11 (37.9) 27 (33.8) Non-emergent 168 (60.4) 97 (57.4) 18 (62.1) 53 (66.3) Pregnancy outcome [4,527] § [2,372] [384] [1,771] Live birth 4,495 (99.3) 2,355 (99.3) 379 (98.7) 1,761 (99.4) Pregnancy loss 32 (0.7) 17 (0.7) 5 (1.3) 10 (0.6) Pregnancy loss <20 weeks 12 (0.3) 10 (0.4) 2 (0.5) 0 (0.0) Pregnancy loss ≥20 weeks 20 (0.4) 7 (0.3) 3 (0.8) 10 (0.6) Gestational age among live births [3,912] [2,137] [287] [1,488] Term (≥37 weeks) 3,406 (87.1) 1,840 (86.1) 244 (85.0) 1,322 (88.8) Preterm (<37 weeks) 506 (12.9) 297 (13.9) 43 (15.0) 166 (11.2) Late preterm (34–36 weeks) 357 (9.1) 211 (9.9) 28 (9.8) 118 (7.9) Moderate preterm (32–33 weeks) 50 (1.3) 32 (1.5) 6 (2.1) 12 (0.8) Very preterm (28–31 weeks) 69 (1.8) 41 (1.9) 6 (2.1) 22 (1.5) Extremely preterm (<28 weeks) 30 (0.8) 13 (0.6) 3 (1.0) 14 (0.9) Infant ICU admission among term live births,¶ n/N (%) 279/2,995 (9.3) 158/1,558 (10.1) 15/173 (8.7) 106/1,264 (8.4) Birth defects among live births,** n/N (%) 28/4,447 (0.6) 18/2,330 (0.8) 2/371 (0.5) 8/1,746 (0.5) Abbreviations: ICU = intensive care unit; IQR = Interquartile range; RT-PCR = reverse transcription–polymerase chain reaction. * Chi-squared tests of association was performed to compare outcomes between women with symptomatic and asymptomatic infection for induction of delivery, cesarean delivery, pregnancy loss, preterm birth, infant ICU admission, and birth defects and was found to be statistically nonsignificant (p>0.1) for all. † Inclusive of women reported as symptomatic on the COVID-19 case report form (https://www.cdc.gov/coronavirus/2019-ncov/php/reporting-pui.html) or who had any symptoms reported on the COVID-19 case report form regardless of completion of the symptom status variable. § Pregnancy outcomes include 79 sets of twins and one set of triplets; therefore, number exceeds the number of women. ¶ Among term (≥37 weeks) infants only, reason for admission could include need for isolation of an otherwise asymptomatic infant based on possible SARS-CoV-2 exposure. ** Includes congenital heart defects (seven), cleft lip and/or palate (four), chromosomal abnormalities (four), genitourinary (four), gastrointestinal (two), cerebral cysts (one), talipes equinovarus (one), developmental dysplasia of the hip (one), supernumerary digits (one) and five had no birth defects specified. Total exceeds 28 because some infants had multiple birth defects reported. Information on infant SARS-CoV-2 testing was reported from 13 jurisdictions; among 923 infants with information, 313 (33.9%) were not tested. Among 610 (21.3%) infants for whom molecular test results were reported, 16 (2.6%) results were positive (Table 3), including 14 for whom the timing of the mothers’ infection during pregnancy was reported. The percent positivity was 4.3% (14 of 328) among infants born to women with documentation of infection identified ≤14 days before delivery and 0% (0 of 84) among those born to women with documentation of infection identified >14 days before delivery. TABLE 3 Characteristics of laboratory-confirmed infection among infants born to pregnant women with laboratory-confirmed SARS-CoV-2 infection — SET-NET, 13* jurisdictions, March 29–October 14, 2020 Characteristic No. of infants (%)[Total no. of infants with available information] Total Not tested or missing data† RT-PCR positive results RT-PCR negative results N = 2,869 (100.0) N = 2,259 (78.7) N = 16 (0.6)§ N = 594 (20.7) Maternal symptom status [1,871] [1,475] [13] [383] Asymptomatic 231 (12.3) 127 (8.6) 4 (30.8) 100 (26.1) Symptomatic 1,640 (87.7) 1,348 (91.4) 9 (69.2) 283 (73.9) Timing of maternal infection¶ [1,851] [1,440] [14] [398] ≤7 days before delivery 740 (40.0) 456 (31.7) 11 (84.6) 273 (68.6) 8–10 days before delivery 77 (4.2) 56 (3.9) 1 (7.7) 20 (5.0) >10 days before delivery 1,034 (55.9) 928 (64.4) 1 (7.7) 105 (26.4) Median (IQR) days from mother’s first positive test to delivery 17 (2–53) 28 (3–63) 1 (0–4) 2 (0–12) Maximum days from mother’s first positive test to delivery 191 191 12 132 Gestational age at birth [2,692] [2,085] [16] [591] Term (≥37 wks) 2,349 (87.3) 1,849 (88.7) 8 (50) 492 (83.2) Late preterm (34–36 wks) 237 (8.8) 168 (8.1) 3 (18.8) 66 (11.2) Moderate to very preterm (<34 wks) 106 (3.9) 68 (3.3) 5 (31.3) 33 (5.6) Infant ICU admission of term infants** n/N (%) 276/2,315 (11.9) 202/1,818 (11.1) 1/8 (12.5) 73/489 (14.9) Abbreviations: ICU = intensive care unit; IQR = interquartile range; RT-PCR = reverse transcription–polymerase chain reaction. *Including California [excluding Los Angeles County], Houston, Los Angeles County, Michigan, Minnesota, Nebraska, New Jersey, North Dakota, Oklahoma, Pennsylvania [excluding Philadelphia], Puerto Rico, Tennessee, and Vermont. † A total of 313 (10.9%) live births were reported as not tested during birth hospitalization, the remainder had no testing results reported. § First positive test result occurred on the second day of life for 11 infants, on the third day for four, and on the fourth day for one. ¶ Defined as either date of specimen collection for first positive test or symptom onset if exact date of collection was missing. **Among term (≥37 weeks) infants only. Reason for admission could include need for isolation of an otherwise asymptomatic infant based on possible SARS-CoV-2 exposure. Eight of the infants with positive test results were born preterm (26–35 weeks); all were admitted to a neonatal ICU (NICU) without indications reported. Among the eight term infants with positive test results, one was admitted to a NICU for fever and receipt of supplemental oxygen, one had no information on NICU admission, and the remaining six were not admitted to a NICU. No neonatal immunoglobulin M or pregnancy-related specimen (e.g., placental tissue or amniotic fluid) testing was reported; thus, routes of transmission (in utero, peripartum, or postnatal) could not be assessed. Discussion In this analysis of COVID-19 SET-NET data from 16 jurisdictions, the proportion of preterm live births among women with SARS-CoV-2 infection during pregnancy (12.9%) was higher than that in the general population in 2019 (10.2%) ( 4 ), suggesting that pregnant women with SARS-CoV-2 infection might be at risk for preterm delivery. These data are preliminary and describe primarily women with second and third trimester infection, and findings are subject to change pending completion of pregnancy for all women in the cohort and enhanced efforts to improve reporting of gestational age. This finding is consistent with other CDC reports describing higher proportions of preterm births among women hospitalized at the time of SARS-CoV-2 infection ( 2 , 3 ) and includes outcomes for women hospitalized as well as those not hospitalized at the time of infection (representing a population including persons with less severe illness). Increased frequency of preterm births was also described in a living, systematic review of SARS-CoV-2 infection in pregnancy ( 5 ). In contrast, a prospective cohort study of 253 infants found no difference in proportion of preterm birth or infant ICU admission between those born to women with positive SARS-CoV-2 test results and those born to women with suspected SARS-CoV-2 but negative test results ( 6 ), although the difference in findings between these two studies might be attributable to differences in case ascertainment, methodology, data collection, and sample size. Studies comparing pregnant women with and without COVID-19 are needed to assess the actual risk of preterm birth. Non-Hispanic Black and Hispanic women were disproportionally represented in this surveillance cohort. Racial and ethnic disparities exist for maternal morbidity, mortality, and adverse birth outcomes ( 7 – 9 ), and the higher incidence and increased severity of COVID-19 among women of color might widen these disparities.*** Further surveillance efforts, including reporting by additional jurisdictions to improve representativeness, and careful analysis of outcomes by race and ethnicity, will permit more direct and targeted public health action. Information regarding the frequency and severity of perinatal (potentially including in utero, peripartum, and postnatal) infection is lacking. The American Academy of Pediatrics and CDC recommend testing all infants born to mothers with suspected or confirmed COVID-19. ††† However, testing results were infrequently reported in this cohort. Perinatal infection was uncommon (2.6%) among infants known to have been tested for SARS-CoV-2 and occurred primarily among infants born to women with infection within 1 week of delivery. Among the infants with positive test results, one half were born preterm, which might reflect higher rates of screening in the ICU. These findings also support the growing evidence that although severe COVID-19 does occur in neonates the majority of term neonates experience asymptomatic infection or mild disease §§§ ; however, information on long term outcomes among exposed infants is unknown. The findings of this report are subject to at least six limitations. First, completeness of variables, particularly those ascertained through interviews or medical record abstraction, varied by jurisdiction. Statistical comparisons by maternal symptom status should be interpreted with caution given that symptom status was missing for a substantial proportion. Ongoing efforts to increase matching reported information with existing data sources has improved case ascertainment and completion of critical data elements. Testing and reporting might be more frequent among women with more severe illness or adverse birth outcomes. Second, these data are not nationally representative and include a higher frequency of Hispanic women compared with all women of reproductive age in national case surveillance data ( 1 ). Third, ascertainment of pregnancy loss depends on linkages to existing data sources (e.g., fetal death reporting), and potential underascertainment of this outcome limits comparison with national estimates. Fourth, few women with first trimester infection and completed pregnancy have been reported to date, limiting ability to evaluate adverse outcomes that might be more likely to be affected by infection earlier in pregnancy, such as birth defects. Fifth, risk factors (e.g., history of previous preterm birth) and clinical details associated with preterm delivery (e.g., spontaneous versus iatrogenic for maternal or fetal indications) were not assessed. Finally, a large proportion of infants had no testing reported. Positive SARS-CoV-2 RT-PCR results are reportable, and this percent positivity is likely an overestimate if negative testing was less often reported. Despite these limitations, this report describes a large population-based cohort with completed pregnancy outcomes and some infant testing. These data can help to inform and counsel persons who acquire COVID-19 during pregnancy about potential risk to their pregnancy and infants; however, the risks associated with infection early in pregnancy and long-term infant outcomes remain unclear. SET-NET will continue to follow pregnancies affected by SARS-CoV-2 through completion of pregnancy and infants until age 6 months to guide clinical and public health practice. Longer-term investigation into solutions to alleviate underlying inequities in social determinants of health associated with disparities in maternal morbidity, mortality, and adverse pregnancy outcomes, and effectively addressing these inequities, could reduce the prevalence of conditions and experiences that might amplify risks from COVID-19. It is important that health care providers counsel pregnant women that SARS-CoV-2 infection might increase the risk for preterm birth and that infants born to women with infection identified >14 days before delivery might have a lower risk of having test results positive to SARS-CoV-2. Pregnant women and their household members should follow recommended infection prevention measures, including wearing a mask, social distancing, and frequent handwashing when going out or interacting with others. In addition, pregnant women should continue measures to ensure their general health including staying up to date with annual influenza vaccination and continuing prenatal care appointments. Summary What is already known about this topic? Pregnant women with SARS-CoV-2 infection are at increased risk for severe illness compared with nonpregnant women. Adverse pregnancy outcomes such as preterm birth and pregnancy loss have been reported. What is added by this report? Among 3,912 infants with known gestational age born to women with SARS-CoV-2 infection, 12.9% were preterm (<37 weeks), higher than a national estimate of 10.2%. Among 610 (21.3%) infants with testing results, 2.6% had positive SARS-CoV-2 results, primarily those born to women with infection at delivery. What are the implications for public health practice? These findings can inform clinical practice, public health practice, and policy. It is important that providers counsel pregnant women on measures to prevent SARS-CoV-2 infection.

          Related collections

          Most cited references8

          • Record: found
          • Abstract: found
          • Article: found
          Is Open Access

          Clinical manifestations, risk factors, and maternal and perinatal outcomes of coronavirus disease 2019 in pregnancy: living systematic review and meta-analysis

          Abstract Objective To determine the clinical manifestations, risk factors, and maternal and perinatal outcomes in pregnant and recently pregnant women with suspected or confirmed coronavirus disease 2019 (covid-19). Design Living systematic review and meta-analysis. Data sources Medline, Embase, Cochrane database, WHO COVID-19 database, China National Knowledge Infrastructure (CNKI), and Wanfang databases from 1 December 2019 to 26 June 2020, along with preprint servers, social media, and reference lists. Study selection Cohort studies reporting the rates, clinical manifestations (symptoms, laboratory and radiological findings), risk factors, and maternal and perinatal outcomes in pregnant and recently pregnant women with suspected or confirmed covid-19. Data extraction At least two researchers independently extracted the data and assessed study quality. Random effects meta-analysis was performed, with estimates pooled as odds ratios and proportions with 95% confidence intervals. All analyses will be updated regularly. Results 77 studies were included. Overall, 10% (95% confidence interval 7% to14%; 28 studies, 11 432 women) of pregnant and recently pregnant women attending or admitted to hospital for any reason were diagnosed as having suspected or confirmed covid-19. The most common clinical manifestations of covid-19 in pregnancy were fever (40%) and cough (39%). Compared with non-pregnant women of reproductive age, pregnant and recently pregnant women with covid-19 were less likely to report symptoms of fever (odds ratio 0.43, 95% confidence interval 0.22 to 0.85; I2=74%; 5 studies; 80 521 women) and myalgia (0.48, 0.45 to 0.51; I2=0%; 3 studies; 80 409 women) and were more likely to need admission to an intensive care unit (1.62, 1.33 to 1.96; I2=0%) and invasive ventilation (1.88, 1.36 to 2.60; I2=0%; 4 studies, 91 606 women). 73 pregnant women (0.1%, 26 studies, 11 580 women) with confirmed covid-19 died from any cause. Increased maternal age (1.78, 1.25 to 2.55; I2=9%; 4 studies; 1058 women), high body mass index (2.38, 1.67 to 3.39; I2=0%; 3 studies; 877 women), chronic hypertension (2.0, 1.14 to 3.48; I2=0%; 2 studies; 858 women), and pre-existing diabetes (2.51, 1.31 to 4.80; I2=12%; 2 studies; 858 women) were associated with severe covid-19 in pregnancy. Pre-existing maternal comorbidity was a risk factor for admission to an intensive care unit (4.21, 1.06 to 16.72; I2=0%; 2 studies; 320 women) and invasive ventilation (4.48, 1.40 to 14.37; I2=0%; 2 studies; 313 women). Spontaneous preterm birth rate was 6% (95% confidence interval 3% to 9%; I2=55%; 10 studies; 870 women) in women with covid-19. The odds of any preterm birth (3.01, 95% confidence interval 1.16 to 7.85; I2=1%; 2 studies; 339 women) was high in pregnant women with covid-19 compared with those without the disease. A quarter of all neonates born to mothers with covid-19 were admitted to the neonatal unit (25%) and were at increased risk of admission (odds ratio 3.13, 95% confidence interval 2.05 to 4.78, I2=not estimable; 1 study, 1121 neonates) than those born to mothers without covid-19. Conclusion Pregnant and recently pregnant women are less likely to manifest covid-19 related symptoms of fever and myalgia than non-pregnant women of reproductive age and are potentially more likely to need intensive care treatment for covid-19. Pre-existing comorbidities, high maternal age, and high body mass index seem to be risk factors for severe covid-19. Preterm birth rates are high in pregnant women with covid-19 than in pregnant women without the disease. Systematic review registration PROSPERO CRD42020178076. Readers’ note This article is a living systematic review that will be updated to reflect emerging evidence. Updates may occur for up to two years from the date of original publication.
            Bookmark
            • Record: found
            • Abstract: found
            • Article: found
            Is Open Access

            Update: Characteristics of Symptomatic Women of Reproductive Age with Laboratory-Confirmed SARS-CoV-2 Infection by Pregnancy Status — United States, January 22–October 3, 2020

            Studies suggest that pregnant women might be at increased risk for severe illness associated with coronavirus disease 2019 (COVID-19) ( 1 , 2 ). This report provides updated information about symptomatic women of reproductive age (15–44 years) with laboratory-confirmed infection with SARS-CoV-2, the virus that causes COVID-19. During January 22–October 3, CDC received reports through national COVID-19 case surveillance or through the National Notifiable Diseases Surveillance System (NNDSS) of 1,300,938 women aged 15–44 years with laboratory results indicative of acute infection with SARS-CoV-2. Data on pregnancy status were available for 461,825 (35.5%) women with laboratory-confirmed infection, 409,462 (88.7%) of whom were symptomatic. Among symptomatic women, 23,434 (5.7%) were reported to be pregnant. After adjusting for age, race/ethnicity, and underlying medical conditions, pregnant women were significantly more likely than were nonpregnant women to be admitted to an intensive care unit (ICU) (10.5 versus 3.9 per 1,000 cases; adjusted risk ratio [aRR] = 3.0; 95% confidence interval [CI] = 2.6–3.4), receive invasive ventilation (2.9 versus 1.1 per 1,000 cases; aRR = 2.9; 95% CI = 2.2–3.8), receive extracorporeal membrane oxygenation (ECMO) (0.7 versus 0.3 per 1,000 cases; aRR = 2.4; 95% CI = 1.5–4.0), and die (1.5 versus 1.2 per 1,000 cases; aRR = 1.7; 95% CI = 1.2–2.4). Stratifying these analyses by age and race/ethnicity highlighted disparities in risk by subgroup. Although the absolute risks for severe outcomes for women were low, pregnant women were at increased risk for severe COVID-19–associated illness. To reduce the risk for severe illness and death from COVID-19, pregnant women should be counseled about the importance of seeking prompt medical care if they have symptoms and measures to prevent SARS-CoV-2 infection should be strongly emphasized for pregnant women and their families during all medical encounters, including prenatal care visits. Understanding COVID-19–associated risks among pregnant women is important for prevention counseling and clinical care and treatment. Data on laboratory-confirmed and probable COVID-19 cases † were electronically reported to CDC using a standardized case report form § or NNDSS ¶ as part of COVID-19 surveillance efforts. Data are reported by health departments and can be updated by health departments as new information becomes available. This analysis included cases initially reported to CDC during January 22–October 3, 2020, with data updated as of October 28, 2020. Cases were limited to those in symptomatic women aged 15–44 years in the United States with laboratory-confirmed infection (detection of SARS-CoV-2 RNA in a clinical specimen using a molecular amplification detection test). Information on demographic characteristics, pregnancy status, underlying medical conditions, symptoms, and outcomes was collected. Pregnancy status was ascertained by a pregnancy field on the COVID-19 case report form or through records linked to the Surveillance for Emerging Threats to Mothers and Babies Network (SET-NET) optional COVID-19 module** , †† ( 3 ). CDC ascertained symptom status either through a reported symptom status variable (symptomatic, asymptomatic, or unknown) or based on the presence of at least one specific symptom on the case report form. Outcomes with missing data were assumed not to have occurred. Crude and adjusted RRs and 95% CIs were calculated using modified Poisson regression. Overall and stratified risk ratios were adjusted for age (in years), race/ethnicity, and presence of diabetes, cardiovascular disease (including hypertension), and chronic lung disease. SAS (version 9.4; SAS Institute) was used to conduct all analyses. This activity was reviewed by CDC and was conducted consistent with applicable federal law and CDC policy. §§ During January 22–October 3, a total of 5,003,041 laboratory-confirmed cases of SARS-CoV-2 infection were reported to CDC as part of national COVID-19 case surveillance, including 1,300,938 (26.0%) cases in women aged 15–44 years. Data on pregnancy status were available for 461,825 (35.5%) women aged 15–44 years, 30,415 (6.6%) of whom were pregnant and 431,410 (93.4%) of whom were nonpregnant. Among all women aged 15–44 years with known pregnancy status, 409,462 (88.7%) were symptomatic, including 23,434 pregnant women, accounting for 5.7% of all symptomatic women with laboratory-confirmed COVID-19, and 386,028 nonpregnant women. Pregnant women were more frequently Hispanic/Latina (Hispanic) (29.7%) and less frequently non-Hispanic White (White) (23.5%) compared with nonpregnant women (22.6% Hispanic and 31.7% White). Among all women, cough, headache, muscle aches, and fever were the most frequently reported signs and symptoms; most symptoms were reported less frequently by pregnant women than by nonpregnant women (Table 1). TABLE 1 Demographic characteristics, signs and symptoms, and underlying medical conditions among symptomatic women of reproductive age with laboratory-confirmed SARS-CoV-2 infection (N = 409,462),* ,† by pregnancy status — United States, January 22–October 3, 2020 Characteristic No. (%) of symptomatic women Pregnant (n = 23,434) Nonpregnant (n = 386,028) Total (N = 409,462) Age group, yrs 15–24 6,463 (27.6) 133,032 (34.5) 139,495 (34.1) 25–34 12,951 (55.3) 131,835 (34.2) 144,786 (35.4) 35–44 4,020 (17.2) 121,161 (31.4) 125,181 (30.6) Race/Ethnicity § Hispanic or Latina, any race 6,962 (29.7) 85,618 (22.2) 92,580 (22.6) AI/AN, non-Hispanic 113 (0.5) 1,652 (0.4) 1,765 (0.4) Asian, non-Hispanic 560 (2.4) 8,605 (2.2) 9,165 (2.2) Black, non-Hispanic 3,387 (14.5) 54,185 (14.0) 57,572 (14.1) NHPI, non-Hispanic 119 (0.5) 1,526 (0.4) 1,645 (0.4) White, non-Hispanic 5,508 (23.5) 124,305 (32.2) 129,813 (31.7) Multiple or other race, non-Hispanic 726 (3.1) 12,341 (3.2) 13,067 (3.2) Signs and symptoms Known status of individual signs and symptoms¶ 10,404 174,198 184,602 Cough 5,230 (50.3) 89,422 (51.3) 94,652 (51.3) Fever** 3,328 (32.0) 68,536 (39.3) 71,864 (38.9) Muscle aches 3,818 (36.7) 78,725 (45.2) 82,543 (44.7) Chills 2,537 (24.4) 50,836 (29.2) 53,373 (28.9) Headache 4,447 (42.7) 95,713 (54.9) 100,160 (54.3) Shortness of breath 2,692 (25.9) 43,234 (24.8) 45,926 (24.9) Sore throat 2,955 (28.4) 60,218 (34.6) 63,173 (34.2) Diarrhea 1,479 (14.2) 38,165 (21.9) 39,644 (21.5) Nausea or vomiting 2,052 (19.7) 28,999 (16.6) 31,051 (16.8) Abdominal pain 870 (8.4) 16,123 (9.3) 16,993 (9.2) Runny nose 1,328 (12.8) 22,750 (13.1) 24,078 (13.0) New loss of taste or smell†† 2,234 (21.5) 43,256 (24.8) 45,490 (24.6) Fatigue 1,404 (13.5) 29,788 (17.1) 31,192 (16.9) Wheezing 172 (1.7) 3,743 (2.1) 3,915 (2.1) Chest pain 369 (3.5) 7,079 (4.1) 7,448 (4.0) Underlying medical conditions Known underlying medical condition status§§ 7,795 160,065 167,860 Diabetes mellitus 427 (5.5) 6,119 (3.8) 6,546 (3.9) Cardiovascular disease 304 (3.9) 7,703 (4.8) 8,007 (4.8) Chronic lung disease 506 (6.5) 9,185 (5.7) 9,691 (5.8) Chronic renal disease 18 (0.2) 680 (0.4) 698 (0.4) Chronic liver disease 17 (0.2) 350 (0.2) 367 (0.2) Immunocompromised condition 124 (1.6) 2,496 (1.6) 2,620 (1.6) Neurologic disorder, neurodevelopmental disorder, or intellectual disability 44 (0.6) 1,097 (0.7) 1,141 (0.7) Psychiatric disorder 62 (0.8) 1,139 (0.7) 1,201 (0.7) Autoimmune disorder 26 (0.3) 515 (0.3) 541 (0.3) Severe obesity¶¶ 174 (2.2) 1,810 (1.1) 1,984 (1.2) Abbreviations: AI/AN = American Indian or Alaska Native; NHPI = Native Hawaiian or Other Pacific Islander. * Women with known pregnancy status, representing 52% of 783,072 total cases among symptomatic women aged 15–44 years. † All statistical comparisons were significant at α 100.4°F [38°C] or subjective), cough, shortness of breath, wheezing, difficulty breathing, chills, rigors, myalgia, rhinorrhea, sore throat, chest pain, nausea or vomiting, abdominal pain, headache, fatigue, diarrhea (three or more loose stools in a 24-hour period), new olfactory or taste disorder, or other symptom not otherwise specified on the form. ** Patients were included if they had information for either measured or subjective fever variables and were considered to have a fever if “yes” was indicated for either variable. †† New olfactory and taste disorder has only been included on the CDC’s Human Infection with 2019 Novel Coronavirus Case Report Form since May 5, 2020. Therefore, data might be underreported for this symptom. §§ Status was classified as “known” if any of the following conditions were noted as present or absent on the CDC’s Human Infection with 2019 Novel Coronavirus Case Report Form: diabetes mellitus, cardiovascular disease (including hypertension), severe obesity (body mass index ≥40 kg/m2), chronic renal disease, chronic liver disease, chronic lung disease, immunosuppressive condition, autoimmune condition, neurologic condition (including neurodevelopmental, intellectual, physical, visual, or hearing impairment), psychological/psychiatric condition, and other underlying medical condition not otherwise specified. ¶¶ Defined as body mass index ≥40 kg/m2. Compared with nonpregnant women, pregnant women more frequently were admitted to an ICU (10.5 versus 3.9 per 1,000 cases; aRR = 3.0; 95% CI = 2.6–3.4), received invasive ventilation (2.9 versus 1.1 per 1,000 cases; aRR = 2.9; 95% CI = 2.2–3.8) and received ECMO (0.7 versus 0.3 per 1,000 cases; aRR = 2.4; 95% CI = 1.5–4.0). Thirty-four deaths (1.5 per 1,000 cases) were reported among 23,434 symptomatic pregnant women, and 447 (1.2 per 1,000 cases) were reported among 386,028 nonpregnant women, reflecting a 70% increased risk for death associated with pregnancy (aRR = 1.7; 95% CI = 1.2–2.4). Irrespective of pregnancy status, ICU admissions, receipt of invasive ventilation, and death occurred more often among women aged 35–44 years than among those aged 15–24 years (Table 2). Whereas non-Hispanic Black or African American (Black) women made up 14.1% of women included in this analysis, they represented 176 (36.6%) deaths overall, including nine of 34 (26.5%) deaths among pregnant women and 167 of 447 (37.4%) deaths among nonpregnant women. TABLE 2 Intensive care unit (ICU) admissions, receipt of invasive ventilation, receipt of extracorporeal membrane oxygenation (ECMO), and deaths among symptomatic women of reproductive age with laboratory-confirmed SARS-CoV-2 (N = 409,462), by pregnancy status, age, race/ethnicity, and underlying health conditions — United States, January 22–October 3, 2020 Outcome*/Characteristic No. (per 1,000 cases) of symptomatic women Risk ratio (95% CI) Pregnant (n = 23,434) Nonpregnant (n = 386,028) Crude† Adjusted†,§ ICU admission¶ All 245 (10.5) 1,492 (3.9) 2.7 (2.4–3.1) 3.0 (2.6–3.4) Age group, yrs 15–24 49 (7.6) 244 (1.8) 4.1 (3.0–5.6) 3.9 (2.8–5.3) 25–34 118 (9.1) 467 (3.5) 2.6 (2.1–3.1) 2.4 (2.0–3.0) 35–44 78 (19.4) 781 (6.4) 3.0 (2.4–3.8) 3.2 (2.5–4.0) Race/Ethnicity Hispanic or Latina 89 (12.8) 429 (5.0) 2.6 (2.0–3.2) 2.8 (2.2–3.5) AI/AN, non-Hispanic 0 (0) 13 (7.9) NA NA Asian, non-Hispanic 20 (35.7) 52 (6.0) 5.9 (3.6–9.8) 6.6 (4.0–11.0) Black, non-Hispanic 46 (13.6) 334 (6.2) 2.2 (1.6–3.0) 2.8 (2.0–3.8) NHPI, non-Hispanic 5 (42.0) 22 (14.4) 2.9 (1.1–7.6) 3.7 (1.3–10.1) White, non-Hispanic 31 (5.6) 348 (2.8) 2.0 (1.4–2.9) 2.3 (1.6–3.3) Multiple or other race, non-Hispanic 8 (11.0) 37 (3.0) 3.7 (1.7–7.9) 4.1 (1.9–8.9) Unknown/Not reported 46 (7.6) 257 (2.6) 2.9 (2.1–3.9) 3.4 (2.5–4.7) Underlying health conditions Diabetes 25 (58.5) 274 (44.8) 1.3 (0.9–1.9) 1.5 (1.0–2.2) CVD** 13 (42.8) 247 (32.1) 1.3 (0.8–2.3) 1.5 (0.9–2.6) Chronic lung disease 15 (29.6) 179 (19.5) 1.5 (0.9–2.6) 1.7 (1.0–2.8) Invasive ventilation†† All 67 (2.9) 412 (1.1) 2.7 (2.1–3.5) 2.9 (2.2–3.8) Age group, yrs 15–24 11 (1.7) 68 (0.5) 3.3 (1.8–6.3) 3.0 (1.6–5.7) §§ 25–34 30 (2.3) 123 (0.9) 2.5 (1.7–3.7) 2.5 (1.6–3.7) §§ 35–44 26 (6.5) 221 (1.8) 3.5 (2.4–5.3) 3.6 (2.4–5.4) Race/Ethnicity Hispanic or Latina 33 (4.7) 143 (1.7) 2.8 (1.9–4.1) 3.0 (2.1–4.5) AI/AN, non-Hispanic 0 (0) 5 (3.0) NA NA Asian, non-Hispanic 4 (7.1) 19 (2.2) NA NA Black, non-Hispanic 10 (3) 86 (1.6) 1.9 (1.0–3.6) 2.5 (1.3–4.9) NHPI, non-Hispanic 4 (33.6) 10 (6.6) NA NA White, non-Hispanic 12 (2.2) 102 (0.8) 2.7 (1.5–4.8) 3.0 (1.7–5.6) Multiple or other race, non-Hispanic 0 (0) 8 (0.6) NA NA Unknown/Not reported 4 (0.7) 39 (0.4) NA NA Underlying health conditions Diabetes 10 (23.4) 98 (16.0) 1.5 (0.8–2.8) 1.7 (0.9–3.3) CVD** 6 (19.7) 82 (10.6) 1.9 (0.8–4.2) 1.9 (0.8–4.5) ¶¶ Chronic lung disease 4 (7.9) 50 (5.4) NA NA ECMO*** All 17 (0.7) 120 (0.3) 2.3 (1.4–3.9) 2.4 (1.5–4.0) Age group,yrs 15–24 6 (0.9) 31 (0.2) 4.0 (1.7–9.5) NA††† 25–34 7 (0.5) 35 (0.3) 2.0 (0.9–4.6) 2.0 (0.9–4.4) §§ 35–44 4 (1.0) 54 (0.4) NA NA Race/Ethnicity Hispanic or Latina 6 (0.9) 35 (0.4) 2.1 (0.9–5.0) 2.4 (1.0–5.9) AI/AN, non-Hispanic 0 (0) 1 (0.6) NA NA Asian, non-Hispanic 0 (0) 1 (0.1) NA NA Black, non-Hispanic 5 (1.5) 30 (0.6) 2.7 (1.0–6.9) 2.9 (1.1–7.3) NHPI, non-Hispanic 0 (0) 2 (1.3) NA NA White, non-Hispanic 4 (0.7) 29 (0.2) NA NA Multiple or other race, non-Hispanic 0 (0) 3 (0.2) NA NA Unknown/Not reported 2 (0.3) 19 (0.2) NA NA Underlying health conditions Diabetes 1 (2.3) 13 (2.1) NA NA CVD** 1 (3.3) 20 (2.6) NA NA Chronic lung disease 1 (2.0) 20 (2.2) NA NA Death§§§ All 34 (1.5) 447 (1.2) 1.3 (0.9–1.8) 1.7 (1.2–2.4) Age group, yrs 15–24 2 (0.3) 40 (0.3) NA NA 25–34 15 (1.2) 125 (0.9) 1.2 (0.7–2.1) 1.2 (0.7–2.1) 35–44 17 (4.2) 282 (2.3) 1.8 (1.1–3.0) 2.0 (1.2–3.2) Race/Ethnicity Hispanic or Latina 14 (2.0) 87 (1.0) 2.0 (1.1–3.5) 2.4 (1.3–4.3) AI/AN, non-Hispanic 0 (0) 5 (3.0) NA NA Asian, non-Hispanic 1 (1.8) 11 (1.3) NA NA Black, non-Hispanic 9 (2.7) 167 (3.1) 0.9 (0.4–1.7) 1.4 (0.7–2.7) NHPI, non-Hispanic 2 (16.8) 6 (3.9) NA NA White, non-Hispanic 3 (0.5) 83 (0.7) NA NA Multiple or other race, non-Hispanic 0 (0) 12 (1.0) NA NA Unknown/Not reported 5 (0.8) 76 (0.8) 1.1 (0.4–2.6) 1.4 (0.6–3.6) Underlying health conditions Diabetes 6 (14.1) 78 (12.7) 1.1 (0.5–2.5) 1.5 (0.6–3.5) ¶¶¶ CVD** 7 (23.0) 89 (11.6) 2.0 (0.9–4.3) 2.2 (1.0–4.8)**** Chronic lung disease 1 (2.0) 37 (4.0) NA NA Abbreviations: AI/AN = American Indian/Alaska Native; CI = confidence interval; CVD = cardiovascular disease; NA = not applicable; NHPI = Native Hawaiian or Other Pacific Islander. * Percentages calculated among total in pregnancy status group. † Crude and adjusted risk ratios were not calculated for cell sizes <5. § Adjusted for age (continuous variable, in years), categorical race/ethnicity variable, and dichotomous indicators for diabetes, cardiovascular disease, and chronic lung disease. ¶ A total of 17,007 (72.6%) symptomatic pregnant women and 291,539 (75.5%) symptomatic nonpregnant women were missing information on ICU admission status; however, while hospital admission status was not separately analyzed, hospitalization status was missing for 2,393 (10.2%) symptomatic pregnant women and 35,624 (9.2%) of symptomatic nonpregnant women, and no hospital admission was reported for 16,672 (71.1%) pregnant and 337,414 (87.4%) nonpregnant women. Therefore, in the absence of reported hospital admissions, women with missing ICU admission information were assumed to have not been admitted to the ICU. ** Cardiovascular disease also accounts for presence of hypertension. †† A total of 17,903 (76.4%) pregnant women and 299,413 (77.6%) nonpregnant women were missing information regarding receipt of invasive ventilation and were assumed to have not received it. §§ Adjusted for the presence of diabetes, CVD, and chronic lung disease only, and removed race/ethnicity from adjustment set because of model convergence issues . ¶¶ Adjusted for the presence of diabetes and chronic lung disease and age as a continuous covariate only and removed race/ethnicity from adjustment set because of model convergence issues. *** A total of 18,246 (77.9%) pregnant women and 298,608 (77.4%) nonpregnant women were missing information for receipt of ECMO and were assumed to have not received ECMO. ††† Model failed to converge even after adjustment for a reduced set of covariates. §§§ A total of 5,152 (22.0%) pregnant women and 66,346 (17.2%) nonpregnant women were missing information on death and were assumed to have survived. ¶¶¶ Adjusted for the presence of CVD and chronic lung disease and age as a continuous variable. **** Adjusted for presence of diabetes and chronic lung disease and age as a continuous variable. Increased risk for ICU admission among pregnant women was observed for all strata but was particularly notable among non-Hispanic Asian (Asian) women (aRR = 6.6; 95% CI = 4.0–11.0) and non-Hispanic Native Hawaiian/Pacific Islander women (aRR = 3.7; 95% CI = 1.3–10.1). Risk for receiving invasive ventilation among pregnant women aged 15–24 years was 3.0 times that of nonpregnant women (95% CI = 1.6–5.7), and among pregnant women aged 35–44 years was 3.6 times that of nonpregnant women (95% CI = 2.4–5.4). In addition, among Hispanic women, pregnancy was associated with 2.4 times the risk for death (95% CI = 1.3-4.3) (Table 2). Discussion Although the absolute risks for severe COVID-19–associated outcomes among women were low, pregnant women were at significantly higher risk for severe outcomes compared with nonpregnant women. This finding might be related to physiologic changes in pregnancy, including increased heart rate and oxygen consumption, decreased lung capacity, a shift away from cell-mediated immunity, and increased risk for thromboembolic disease ( 4 , 5 ). Compared with the initial report of these data ( 1 ), in which increased risk for ICU admissions and invasive ventilation among pregnant women was reported, this analysis includes nearly five times the number of symptomatic women and a higher proportion of women with known pregnancy status (36% versus 28%). Further, to avoid including pregnant women who were tested as part of asymptomatic screening practices at the delivery hospitalization, this analysis was limited to symptomatic women. In this analysis 5.7% of symptomatic women aged 15–44 years with COVID-19 were pregnant, corresponding to the anticipated proportion of 5% of the population at any point in time. ¶¶ , *** Whereas increased risk for severe disease related to pregnancy was apparent in nearly all stratified analyses, pregnant women aged 35–44 years with COVID-19 were nearly four times as likely to require invasive ventilation and twice as likely to die than were nonpregnant women of the same age. Among symptomatic pregnant women with COVID-19 for whom race/ethnicity was reported, 30% were Hispanic and 24% were White, differing from the overall reported racial/ethnic distribution of women who gave birth in 2019 (24% Hispanic and 51% White). ††† Pregnant Asian and Native Hawaiian/Pacific Islander women appeared to be at disproportionately greater risk for ICU admission. Hispanic pregnant women of any race not only experienced a disproportionate risk for SARS-CoV-2 infection but also a higher risk for death compared with nonpregnant Hispanic women. Regardless of pregnancy status, non-Hispanic Black women experienced a disproportionate number of deaths relative to their distribution among reported cases. This analysis highlights racial and ethnic disparities in both risk for infection and disease severity among pregnant women, indicating a need to address potential drivers of risk in these populations. The findings in this report are subject to at least three limitations. First, national case surveillance data for COVID-19 are voluntarily reported to CDC and rely on health care providers and jurisdictional public health agencies to share information for patients who meet standard case definitions. The mechanism used to report cases and the capacity to investigate cases varies across jurisdictions. §§§ Thus, case information is limited or unavailable for a portion of detected COVID-19 cases, and reported case data might be updated at any time. This analysis was restricted to women with known age; however, pregnancy status was missing for over one half (64.5%) of reported cases, and among those with known pregnancy status, data on race/ethnicity were missing for approximately 25% of cases, and information on symptoms and underlying conditions was missing for approximately one half. Second, when estimating the proportion of cases with severe outcomes, the observational data collected through passive surveillance might be subject to reporting bias, wherein preferential ascertainment of severe cases is likely ( 6 , 7 ); therefore, the frequency of reported outcomes incorporates a denominator of all cases as a conservative estimate. Finally, severe outcomes might require additional time to be ascertained. To account for this, a time lag was incorporated, such that data reported as of October 28, 2020, were used for cases reported as of October 3. This analysis supports previous findings that pregnancy is associated with increased risk for ICU admission and receipt of invasive ventilation among women of reproductive age with COVID-19 ( 1 , 2 ). In the current report, an increased risk for receiving ECMO and death was also observed, which are two additional important markers of COVID-19 severity that support previous findings. In comparison to influenza, a recent meta-analysis found no increased risk for ICU admission or death among pregnant women with seasonal influenza ( 8 ). However, data from previous influenza pandemics, including 2009 H1N1, have shown that pregnant women are at increased risk for severe outcomes including death and the absolute risks for severe outcomes were higher than in this study of COVID-19 during pregnancy ( 9 ). Longitudinal surveillance and cohort studies among pregnant women with COVID-19, including information about pregnancy outcomes, are necessary to understand the full spectrum of maternal and neonatal outcomes associated with COVID-19 in pregnancy. CDC, in collaboration with health departments, has adapted SET-NET to collect pregnancy-related information and pregnancy and neonatal outcomes among women with COVID-19 during pregnancy ¶¶¶ ( 3 ). Understanding the risk posed by SARS-CoV-2 infection in pregnant women can inform clinical practice, risk communication, and medical countermeasure allocation. Pregnant women should be informed of their risk for severe COVID-19–associated illness and the warning signs of severe COVID-19.**** To minimize the risk for acquiring SARS-CoV-2 infection, pregnant women should limit unnecessary interactions with persons who might have been exposed to or are infected with SARS-CoV-2, including those within their household, †††† as much as possible. §§§§ When going out or interacting with others, pregnant women should wear a mask, social distance, avoid persons who are not wearing a mask, and frequently wash their hands. In addition, pregnant women should take measures to ensure their general health, including staying up to date with annual influenza vaccination and prenatal care. Providers who care for pregnant women should be familiar with guidelines for medical management of COVID-19, including considerations for management of COVID-19 in pregnancy. ¶¶¶¶ , ***** Additional data from surveillance and cohort studies on COVID-19 severity during pregnancy are necessary to inform messaging and patient counseling. Summary What is already known about this topic? Limited information suggests that pregnant women with COVID-19 might be at increased risk for severe illness compared with nonpregnant women. What is added by this report? In an analysis of approximately 400,000 women aged 15–44 years with symptomatic COVID-19, intensive care unit admission, invasive ventilation, extracorporeal membrane oxygenation, and death were more likely in pregnant women than in nonpregnant women. What are the implications for public health practice? Pregnant women should be counseled about the risk for severe COVID-19–associated illness including death; measures to prevent infection with SARS-CoV-2 should be emphasized for pregnant women and their families. These findings can inform clinical practice, risk communication, and medical countermeasure allocation.
              Bookmark
              • Record: found
              • Abstract: found
              • Article: found
              Is Open Access

              Racial/Ethnic Disparities in Pregnancy-Related Deaths — United States, 2007–2016

              Approximately 700 women die in the United States each year as a result of pregnancy or its complications, and significant racial/ethnic disparities in pregnancy-related mortality exist ( 1 ). Data from CDC’s Pregnancy Mortality Surveillance System (PMSS) for 2007–2016 were analyzed. Pregnancy-related mortality ratios (PRMRs) (i.e., pregnancy-related deaths per 100,000 live births) were analyzed by demographic characteristics and state PRMR tertiles (i.e., states with lowest, middle, and highest PRMR); cause-specific proportionate mortality by race/ethnicity also was calculated. Over the period analyzed, the U.S. overall PRMR was 16.7 pregnancy-related deaths per 100,000 births. Non-Hispanic black (black) and non-Hispanic American Indian/Alaska Native (AI/AN) women experienced higher PRMRs (40.8 and 29.7, respectively) than did all other racial/ethnic groups. This disparity persisted over time and across age groups. The PRMR for black and AI/AN women aged ≥30 years was approximately four to five times that for their white counterparts. PRMRs for black and AI/AN women with at least some college education were higher than those for all other racial/ethnic groups with less than a high school diploma. Among state PRMR tertiles, the PRMRs for black and AI/AN women were 2.8–3.3 and 1.7–3.3 times as high, respectively, as those for non-Hispanic white (white) women. Significant differences in cause-specific proportionate mortality were observed among racial/ethnic populations. Strategies to address racial/ethnic disparities in pregnancy-related deaths, including improving women’s health and access to quality care in the preconception, pregnancy, and postpartum periods, can be implemented through coordination at the community, health facility, patient, provider, and system levels. PMSS was established in 1986 by CDC and the American College of Obstetricians and Gynecologists to better understand the causes of death and risk factors associated with pregnancy-related deaths. Methodology of PMSS has been described previously ( 2 ). Briefly, CDC requests that all states, the District of Columbia, and New York City identify deaths during or within 1 year of pregnancy and send corresponding death certificates, linked birth or fetal death certificates, and additional data when available. Medically trained epidemiologists review information and determine the relatedness to pregnancy and cause for each death. A death was considered pregnancy-related if it occurred during or within 1 year of pregnancy and was caused by a pregnancy complication, a chain of events initiated by pregnancy, or aggravation of an unrelated condition by the physiologic effects of pregnancy. U.S. natality files were the source of live birth data ( 3 ). PRMRs were analyzed by age group, highest level of education, and calendar year for women who were non-Hispanic white, black, AI/AN, Asian or Pacific Islander (A/PI), and Hispanic. Per the PMSS assurance of confidentiality, state-specific data are not authorized to be released. States were anonymously classified by PRMR and grouped into lowest, middle, and highest tertiles by PRMR; the PRMR was calculated by race/ethnicity per state tertile. Disparity ratios (comparisons of PRMR between two racial/ethnic groups) were calculated by five 2-year intervals, demographic characteristics, and state PRMR tertiles. White decedents were the referent group because they represented the largest racial/ethnic group. Cause-specific proportionate mortality was classified in 10 mutually exclusive categories,* and differences by race/ethnicity were identified using chi-squared tests. SAS statistical software (version 9.4; SAS Institute) was used for the analyses. During 2007–2016, a total of 6,765 pregnancy-related deaths occurred in the United States (PRMR = 16.7 per 100,000 births). PRMRs were highest among black (40.8) and AI/AN (29.7) women; these rates were 3.2 and 2.3 times the PRMR for white women (12.7) (Table 1). From 2007–2008 to 2015–2016, the overall PRMR increased slightly from 15.0 to 17.0. The disparity ratios did not change significantly over time. TABLE 1 Pregnancy-related mortality ratios (PRMRs) (pregnancy-related deaths per 100,000 live births) and disparity ratios by age group, education, tertile of states, and race/ethnicity* — United States, 2007–2016 † Characteristic Total PRMR White PRMR Black PRMR Black: white disp. ratio AI/AN PRMR AI/AN: white disp. ratio A/PI PRMR A/PI: white disp. ratio Hispanic PRMR Hispanic: white disp. ratio Total 16.7 12.7 40.8 3.2 29.7 2.3 13.5 1.1 11.5 0.9 Age group (yrs)   <20 10.9 10.8 16.8 1.5 19.5 1.8 —§ — 6.7 0.6   20–24 12.2 9.6 26.3 2.7 11.6 1.2 7.2 0.7 7.0 0.7   25–29 13.3 9.3 37.0 4.0 25.2 2.7 9.5 1.0 9.6 1.0   30–34 15.8 11.3 48.6 4.3 41.2 3.7 12.5 1.1 12.6 1.1   35–39 27.7 20.5 80.7 3.9 104.2 5.1 18.8 0.9 22.6 1.1   ≥40 65.2 51.5 189.7 3.7 — — 36.6 0.7 44.0 0.9 Education completed   Less than high school 21.6 25.0 45.6 1.8 50.8 2.0 18.7 0.7 12.6 0.5   High school 27.4 25.2 59.1 2.3 43.7 1.7 22.9 0.9 11.2 0.4   Some college 16.4 11.7 41.0 3.5 32.0 2.7 15.4 1.3 9.4 0.8   College graduate or higher 10.9 7.8 40.2 5.2 — — 13.2 1.7 9.3 1.2 Period   2007–2008 15.0 11.5 35.6 3.1 26.9 2.3 11.4 1.0 10.8 0.9   2009–2010 17.3 12.8 41.6 3.2 30.7 2.4 13.6 1.1 12.8 1.0   2011–2012 16.8 12.4 44.3 3.6 38.4 3.1 11.6 0.9 10.4 0.8   2013–2014 17.6 13.5 42.1 3.1 30.3 2.2 15.8 1.2 12.0 0.9   2015–2016 17.0 13.2 40.8 3.1 21.9 1.7 14.7 1.1 11.6 0.9 State-level PRMR tertile   Lowest PRMR 10.7 8.7 26.0 3.0 28.9 3.3 11.9 1.4 9.7 1.1   Middle PRMR 15.4 11.0 36.9 3.3 33.9 3.1 14.2 1.3 11.7 1.1   Highest PRMR 21.9 16.6 45.9 2.8 28.8 1.7 15.8 0.9 13.2 0.8 Abbreviations: AI/AN = American Indian/Alaska Native; A/PI = Asian/Pacific Islander. * Blacks, whites, AI/AN, and A/PI were non-Hispanic; Hispanic women might be of any race. † 25 pregnancy-related deaths with unknown race/ethnicity were included in the total analyses but not presented in an individual column; two pregnancy-related deaths with unknown age were excluded from age analyses; 687 pregnancy-related deaths with unknown educational levels were excluded from education analyses. § Dashes indicate fewer than 10 deaths; these results were suppressed because ratios might be unreliable. PRMR increased with maternal age; the black:white disparity was lowest among women aged <20 years (1.5) and highest among those aged 30–34 years (4.3); the AI/AN:white disparity was lowest among women aged 20–24 years (1.2) and was highest among women aged 35–39 years (5.1). Racial/ethnic disparities were present at all education levels. The PRMR among black women with a completed college education or higher was 1.6 times that of white women with less than a high school diploma. Among women with a college education or higher, the PRMR for black women was 5.2 times that of their white counterparts. The black:white disparity ratio in the PRMR for the states in the lowest, middle, and highest tertiles was 3.0, 3.3, and 2.8, respectively. Cardiovascular conditions (including cardiomyopathy, other cardiovascular conditions, and cerebrovascular accidents), other noncardiovascular medical conditions, and infection were leading causes of pregnancy-related deaths. The proportion of pregnancy-related deaths attributed to each of 10 mutually exclusive causes varied by race/ethnicity (Table 2). Cardiomyopathy, thrombotic pulmonary embolism, and hypertensive disorders of pregnancy contributed to a significantly higher proportion of pregnancy-related deaths among black women than among white women. Hemorrhage and hypertensive disorders of pregnancy contributed to a higher proportion of pregnancy-related deaths among AI/AN women than among white women. TABLE 2 Cause-specific pregnancy-related mortality, by race/ethnicity — Pregnancy Mortality Surveillance System, United States, 2007–2016 Cause of death Proportionate cause of death by race/ethnicity* No. (%) attributed to each cause Total deaths White Black AI/AN A/PI Hispanic Hemorrhage 250 (9.1) 237 (9.7) 23 (19.7)† 66 (19.5)† 173 (15.8)† 752 (11.1) Infection 418 (15.2) 235 (9.7)§ 10 (8.5)§ 51 (15.0) 183 (16.7) 900 (13.3) Amniotic fluid embolism 147 (5.3) 106 (4.4) 3 (2.6) 51 (15.0)† 58 (5.3) 365 (5.4) Thrombotic pulmonary or other embolism 246 (8.9) 265 (10.9)† 9 (7.7) 11 (3.2)§ 88 (8.0) 624 (9.2) Hypertensive disorders of pregnancy 184 (6.7) 200 (8.2)† 15 (12.8)† 21 (6.2) 106 (9.7)† 528 (7.8) Anesthesia complications 7 (0.3) 14 (0.6) 0 (0.0) 3 (0.9) 6 (0.5) 30 (0.4) Cerebrovascular accidents 207 (7.5) 148 (6.1)§ 6 (5.1) 37 (10.9)† 92 (8.4) 490 (7.2) Cardiomyopathy 288 (10.4) 345 (14.2)† 17 (14.5) 21 (6.2)§ 75 (6.8)§ 748 (11.1) Other cardiovascular conditions 465 (16.9) 393 (16.2) 13 (11.1) 38 (11.2)§ 124 (11.3)§ 1,035 (15.3) Other noncardiovascular medical conditions 384 (13.9) 343 (14.1) 16 (13.7) 26 (7.7)§ 130 (11.9) 903 (13.3) Unknown 160 (5.8) 146 (6.0) 5 (4.3) 14 (4.1) 61 (5.6) 390 (5.8) Total 2,756 2,432 117 339 1,096 6,765¶ Abbreviations: AI/AN = American Indian/Alaska Native; A/PI = Asian/Pacific Islander. * Black, white, AI/AN, and A/PI women were non-Hispanic; Hispanic women could be of any race. † Significantly higher proportion of pregnancy-related deaths compared with that among white women, p<0.05. § Significantly lower proportion of pregnancy-related deaths compared with that among white women, p<0.05. ¶ Twenty-five pregnancy-related deaths with unknown race/ethnicity were included in the total but not elsewhere in the table. Discussion Racial/ethnic disparities in pregnancy-related mortality were evident in 2007 and continued through 2016, with significantly higher PRMRs among black and AI/AN women than among white, A/PI, and Hispanic women. The PRMR for black and AI/AN women aged ≥30 years was approximately four to five times that of their white counterparts. Even in states with the lowest PRMRs, and among groups with higher levels of education, significant disparities persisted, demonstrating that the disparity in pregnancy-related mortality for black and AI/AN women is a complex national problem. Multiple factors contribute to pregnancy-related mortality and to racial/ethnic disparities. Previous analyses found that for each pregnancy-related death, an average of three to four contributing factors were identified at multiple levels, including community, health facility, patient/family, provider, and system ( 1 ). Thirteen state maternal mortality review committees reported 60% of pregnancy-related deaths were preventable, and there were no significant differences in preventability by race/ethnicity ( 1 ). Differences in proportionate causes of death among black and AI/AN women might reflect differences in access to care, quality of care, and prevalence of chronic diseases ( 4 ). Chronic diseases associated with increased risk for pregnancy-related mortality (e.g., hypertension) are more prevalent and less well controlled in black women ( 5 ). Ensuring access to quality care, including specialist providers, during preconception, pregnancy, and the postpartum period is crucial for all women to identify and manage chronic medical conditions ( 4 ). Systemic factors (e.g., gaps in health care coverage and preventive care, lack of coordinated health care, and social services) and community factors (e.g., securing transportation for medical visits and inadequate housing) have also been identified as contributors to pregnancy-related deaths ( 1 ). Addressing these factors and ensuring that pregnant women at high risk for complications receive care in facilities prepared to provide the required level of specialized care can improve outcomes. † , § In addition, innovative delivery of care models in the preconception, pregnancy, and postpartum periods might be further evaluated for their potential to reduce maternal disparities. Quality of care likely has a role in pregnancy-related deaths and associated racial disparities. A national study of five specific pregnancy complications found a similar prevalence of complications among black and white women, but a significantly higher case-fatality rate among black women ( 6 ). Studies have suggested that black women are more likely than are white women to receive obstetric care in hospitals that provide lower quality of care ( 7 ). Hospitals and health care systems can implement standardized protocols and training in quality improvement initiatives, ensuring implementation in facilities that serve disproportionately affected communities. Quality improvement efforts, such as perinatal quality collaboratives ¶ that facilitate a change in the culture of care provision, implement standards of care,** and rapidly use data to identity opportunities for improvement, can improve the quality of care received by all pregnant and postpartum women. Implicit racial bias has been reported in the health care system and can affect patient-provider interactions, treatment decisions, patient adherence to recommendations, and patient health outcomes ( 8 ). This report’s findings demonstrate that black and AI/AN women have a more accelerated trajectory in age-specific PRMRs compared with white women. This might be related to the “weathering” hypothesis, which proposed that black women experience earlier deterioration of health because of the cumulative impact of exposure to psychosocial, economic, and environmental stressors ( 9 ). Identifying and addressing implicit bias and structural racism in health care and community settings, engaging communities in prevention efforts, and supporting community-based programs that build social support and resiliency would likely improve patient-provider interactions, health communication, and health outcomes ( 4 ). Reducing disparities in pregnancy-related mortality requires addressing multifaceted contributors. Ensuring robust comprehensive data collection and analysis through state and local maternal mortality review committees, which thoroughly review pregnancy-related deaths and make actionable prevention recommendations, offer the best opportunity for identifying priority strategies to reduce disparities in pregnancy-related mortality.†† The findings in this report are subject to at least three limitations. First, PMSS predominantly uses death certificates and linked birth or fetal death certificates to determine the pregnancy-relatedness of each death. Errors in reported pregnancy status on death certificates have been described, potentially leading to overestimation of the number of pregnancy-related deaths ( 10 ). Second, pregnancy-relatedness cannot generally be determined in PMSS for cancer-related deaths or injury deaths such as drug overdoses, suicides, or homicides, and thus, these are often not included in the PRMR calculated from PMSS data. Finally, small cohort sizes precluded the reporting of some factors by race/ethnicity; in addition, there might be inconsistencies in the reporting of race/ethnicity when death certificates were used for classification. §§ Most pregnancy-related deaths can be prevented, and significant racial/ethnic disparities in pregnancy-related mortality need to be addressed. Further identification and evaluation of factors contributing to racial/ethnic disparities are crucial to inform and implement prevention strategies that will effectively reduce disparities in pregnancy-related mortality, including strategies to improve women’s health and access to quality care in the preconception, pregnancy, and postpartum periods. Addressing this complex national problem requires coordination and collaboration among community organizations, health facilities, patients and families, health care providers, and health systems. Summary What is already known about this topic? Approximately 700 women die annually in the United States as a result of pregnancy or its complications; racial/ethnic disparities exist. What is added by this report? During 2007–2016, black and American Indian/Alaska Native women had significantly more pregnancy-related deaths per 100,000 births than did white, Hispanic, and Asian/Pacific Islander women. Disparities persisted over time and across age groups and were present even in states with the lowest pregnancy-related mortality ratios and among groups with higher levels of education. The cause-specific proportion of pregnancy-related deaths varied by race/ethnicity. What are the implications for public health practice? Identifying factors that drive differences in pregnancy-related deaths and implementing prevention strategies to address them could reduce racial/ethnic disparities in pregnancy-related mortality. Strategies to address racial/ethnic disparities in pregnancy-related deaths, including improving women’s health and access to quality care in the preconception, pregnancy, and postpartum periods, can be implemented through coordination at the community, health facility, patient and family, health care provider, and system levels.
                Bookmark

                Author and article information

                Contributors
                Journal
                MMWR Morb Mortal Wkly Rep
                MMWR Morb Mortal Wkly Rep
                WR
                Morbidity and Mortality Weekly Report
                Centers for Disease Control and Prevention
                0149-2195
                1545-861X
                06 November 2020
                06 November 2020
                : 69
                : 44
                : 1635-1640
                Affiliations
                CDC COVID-19 Response; New Jersey Department of Health; Massachusetts Department of Public Health; Tennessee Department of Health; New York State Department of Health; Georgia Department of Public Health; Michigan Department of Health and Human Services; Minnesota Department of Health; Nebraska Department of Health and Human Services; Oklahoma State Health Department; Los Angeles County Department of Public Health; Puerto Rico Department of Health; Pennsylvania Department of Health; California Department of Public Health; North Dakota Department of Health; Houston Health Department; Vermont Department of Health.
                CDC
                CDC
                CDC
                CDC
                CDC
                CDC
                CDC
                CDC
                CDC
                CDC
                CDC
                CDC
                CDC
                CDC
                CDC
                Massachusetts Department of Public Health
                Eagle Medical Services
                Eagle Global Scientific
                Eagle Global Scientific
                Eagle Global Scientific
                Eagle Global Scientific
                Eagle Global Scientific
                Eagle Global Scientific
                Eagle Global Scientific
                Epidemic Intelligence Service
                Oak Ridge Institute for Science and Education
                Oak Ridge Institute for Science and Education
                Oak Ridge Institute for Science and Education
                Oak Ridge Institute for Science and Education.
                Author notes
                Corresponding author: Kate Woodworth, eocevent397@ 123456cdc.gov .
                Article
                mm6944e2
                10.15585/mmwr.mm6944e2
                7643898
                33151917
                1fd0b3df-90ff-4b30-b2c4-d41066510107

                All material in the MMWR Series is in the public domain and may be used and reprinted without permission; citation as to source, however, is appreciated.

                History
                Categories
                Full Report

                Comments

                Comment on this article

                scite_

                Similar content20

                Cited by178

                Most referenced authors323