4
views
0
recommends
+1 Recommend
1 collections
    0
    shares
      • Record: found
      • Abstract: found
      • Article: found
      Is Open Access

      Quantifying the relationship between lockdowns, mobility, and effective reproduction number (Rt) during the COVID-19 pandemic in the Greater Toronto Area

      research-article
      1 , 2 , , 3
      BMC Public Health
      BioMed Central
      COVID-19, Lockdown, Pandemic, Mobility

      Read this article at

      Bookmark
          There is no author summary for this article yet. Authors can add summaries to their articles on ScienceOpen to make them more accessible to a non-specialist audience.

          Abstract

          Background

          The effectiveness of lockdowns in mitigating the spread of COVID-19 has been the subject of intense debate. Data on the relationship between public health restrictions, mobility, and pandemic growth has so far been conflicting.

          Objective

          We assessed the relationship between public health restriction tiers, mobility, and COVID-19 spread in five contiguous public health units (PHUs) in the Greater Toronto Area (GTA) in Ontario, Canada.

          Methods

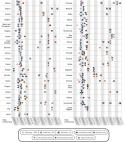
          Weekly effective reproduction number (R t) was calculated based on daily cases in each of the five GTA public health units between March 1, 2020, and March 19, 2021. A global mobility index (GMI) for each PHU was calculated using Google Mobility data. Segmented regressions were used to assess changes in the behaviour of R t over time. We calculated Pearson correlation coefficients between GMI and R t for each PHU and mobility regression coefficients for each mobility variable, accounting for time lag of 0, 7, and 14 days.

          Results

          In all PHUs except Toronto, the most rapid decline in R t occurred in the first 2 weeks of the first province-wide lockdown, and this was followed by a slight trend to increased R t as restrictions decreased. This trend reversed in all PHUs between September 6th and October 10th after which R t decreased slightly over time without respect to public health restriction tier. GMI began to increase in the first wave even before restrictions were decreased. This secular trend to increased mobility continued into the summer, driven by increased mobility to recreational spaces. The decline in GMI as restrictions were reintroduced coincides with decreasing mobility to parks after September. During the first wave, the correlation coefficients between global mobility and R t were significant ( p < 0.01) in all PHUs 14 days after lockdown, indicating moderate to high correlation between decreased mobility and decreased viral reproduction rates, and reflecting that the incubation period brings in a time-lag effect of human mobility on R t. In the second wave, this relationship was attenuated, and was only significant in Toronto and Durham at 14 days after lockdown.

          Conclusions

          The association between mobility and COVID-19 spread was stronger in the first wave than the second wave. Public health restriction tiers did not alter the existing secular trend toward decreasing R t over time.

          Related collections

          Most cited references18

          • Record: found
          • Abstract: found
          • Article: not found

          Estimating the effects of non-pharmaceutical interventions on COVID-19 in Europe

          Following the detection of the new coronavirus1 severe acute respiratory syndrome coronavirus 2 (SARS-CoV-2) and its spread outside of China, Europe has experienced large epidemics of coronavirus disease 2019 (COVID-19). In response, many European countries have implemented non-pharmaceutical interventions, such as the closure of schools and national lockdowns. Here we study the effect of major interventions across 11 European countries for the period from the start of the COVID-19 epidemics in February 2020 until 4 May 2020, when lockdowns started to be lifted. Our model calculates backwards from observed deaths to estimate transmission that occurred several weeks previously, allowing for the time lag between infection and death. We use partial pooling of information between countries, with both individual and shared effects on the time-varying reproduction number (Rt). Pooling allows for more information to be used, helps to overcome idiosyncrasies in the data and enables more-timely estimates. Our model relies on fixed estimates of some epidemiological parameters (such as the infection fatality rate), does not include importation or subnational variation and assumes that changes in Rt are an immediate response to interventions rather than gradual changes in behaviour. Amidst the ongoing pandemic, we rely on death data that are incomplete, show systematic biases in reporting and are subject to future consolidation. We estimate that-for all of the countries we consider here-current interventions have been sufficient to drive Rt below 1 (probability Rt < 1.0 is greater than 99%) and achieve control of the epidemic. We estimate that across all 11 countries combined, between 12 and 15 million individuals were infected with SARS-CoV-2 up to 4 May 2020, representing between 3.2% and 4.0% of the population. Our results show that major non-pharmaceutical interventions-and lockdowns in particular-have had a large effect on reducing transmission. Continued intervention should be considered to keep transmission of SARS-CoV-2 under control.
            Bookmark
            • Record: found
            • Abstract: found
            • Article: not found

            A New Framework and Software to Estimate Time-Varying Reproduction Numbers During Epidemics

            Abstract The quantification of transmissibility during epidemics is essential to designing and adjusting public health responses. Transmissibility can be measured by the reproduction number R, the average number of secondary cases caused by an infected individual. Several methods have been proposed to estimate R over the course of an epidemic; however, they are usually difficult to implement for people without a strong background in statistical modeling. Here, we present a ready-to-use tool for estimating R from incidence time series, which is implemented in popular software including Microsoft Excel (Microsoft Corporation, Redmond, Washington). This tool produces novel, statistically robust analytical estimates of R and incorporates uncertainty in the distribution of the serial interval (the time between the onset of symptoms in a primary case and the onset of symptoms in secondary cases). We applied the method to 5 historical outbreaks; the resulting estimates of R are consistent with those presented in the literature. This tool should help epidemiologists quantify temporal changes in the transmission intensity of future epidemics by using surveillance data.
              Bookmark
              • Record: found
              • Abstract: found
              • Article: found
              Is Open Access

              Inferring the effectiveness of government interventions against COVID-19

              Governments are attempting to control the COVID-19 pandemic with nonpharmaceutical interventions (NPIs). However, the effectiveness of different NPIs at reducing transmission is poorly understood. We gathered chronological data on the implementation of NPIs for several European, and other, countries between January and the end of May 2020. We estimate the effectiveness of NPIs, ranging from limiting gathering sizes, business closures, and closure of educational institutions to stay-at-home orders. To do so, we used a Bayesian hierarchical model that links NPI implementation dates to national case and death counts and supported the results with extensive empirical validation. Closing all educational institutions, limiting gatherings to 10 people or less, and closing face-to-face businesses each reduced transmission considerably. The additional effect of stay-at-home orders was comparatively small.
                Bookmark

                Author and article information

                Contributors
                Christopher.dainton@gmail.com
                alechay3@gmail.com
                Journal
                BMC Public Health
                BMC Public Health
                BMC Public Health
                BioMed Central (London )
                1471-2458
                11 September 2021
                11 September 2021
                2021
                : 21
                : 1658
                Affiliations
                [1 ]GRID grid.25073.33, ISNI 0000 0004 1936 8227, McMaster University, ; 1280 Main Street W, Hamilton, Ontario L8S 4L8 Canada
                [2 ]GRID grid.413277.4, ISNI 0000 0004 0416 4440, Grand River Hospital, ; 835 King St. West, Kitchener, Ontario N2G 1G3 Canada
                [3 ]GRID grid.94365.3d, ISNI 0000 0001 2297 5165, National Institutes of Health, ; 9000 Rockville Pike, Bethesda, MD 20892 USA
                Article
                11684
                10.1186/s12889-021-11684-x
                8433050
                34507570
                112372a7-0208-4e2c-8971-e5d46bc85005
                © The Author(s) 2021

                Open AccessThis article is licensed under a Creative Commons Attribution 4.0 International License, which permits use, sharing, adaptation, distribution and reproduction in any medium or format, as long as you give appropriate credit to the original author(s) and the source, provide a link to the Creative Commons licence, and indicate if changes were made. The images or other third party material in this article are included in the article's Creative Commons licence, unless indicated otherwise in a credit line to the material. If material is not included in the article's Creative Commons licence and your intended use is not permitted by statutory regulation or exceeds the permitted use, you will need to obtain permission directly from the copyright holder. To view a copy of this licence, visit http://creativecommons.org/licenses/by/4.0/. The Creative Commons Public Domain Dedication waiver ( http://creativecommons.org/publicdomain/zero/1.0/) applies to the data made available in this article, unless otherwise stated in a credit line to the data.

                History
                : 30 March 2021
                : 29 August 2021
                Categories
                Research
                Custom metadata
                © The Author(s) 2021

                Public health
                covid-19,lockdown,pandemic,mobility
                Public health
                covid-19, lockdown, pandemic, mobility

                Comments

                Comment on this article