42
views
0
recommends
+1 Recommend
1 collections
    0
    shares
      • Record: found
      • Abstract: found
      • Article: found
      Is Open Access

      Socioeconomic status determines COVID-19 incidence and related mortality in Santiago, Chile

      Read this article at

          There is no author summary for this article yet. Authors can add summaries to their articles on ScienceOpen to make them more accessible to a non-specialist audience.

          Abstract

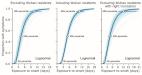
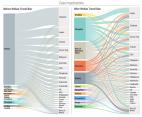
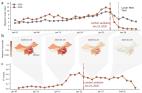
          The current COVID-19 pandemic has impacted cities particularly hard. Here, we provide an in-depth characterization of disease incidence and mortality, and their dependence on demographic and socioeconomic strata in Santiago, a highly segregated city and the capital of Chile. Our analyses show a strong association between socioeconomic status and both COVID-19 outcomes and public health capacity. People living in municipalities with low socioeconomic status did not reduce their mobility during lockdowns as much as those in more affluent municipalities. Testing volumes may have been insufficient early in the pandemic in those places, and both test positivity rates and testing delays were much higher. We find a strong association between socioeconomic status and mortality, measured either by COVID-19 attributed deaths or excess deaths. Finally, we show that infection fatality rates in young people are higher in low-income municipalities. Together, these results highlight the critical consequences of socioeconomic inequalities on health outcomes.

          Related collections

          Most cited references43

          • Record: found
          • Abstract: found
          • Article: found
          Is Open Access

          The effect of travel restrictions on the spread of the 2019 novel coronavirus (COVID-19) outbreak

          Motivated by the rapid spread of COVID-19 in Mainland China, we use a global metapopulation disease transmission model to project the impact of travel limitations on the national and international spread of the epidemic. The model is calibrated based on internationally reported cases, and shows that at the start of the travel ban from Wuhan on 23 January 2020, most Chinese cities had already received many infected travelers. The travel quarantine of Wuhan delayed the overall epidemic progression by only 3 to 5 days in Mainland China, but has a more marked effect at the international scale, where case importations were reduced by nearly 80% until mid February. Modeling results also indicate that sustained 90% travel restrictions to and from Mainland China only modestly affect the epidemic trajectory unless combined with a 50% or higher reduction of transmission in the community.
            Bookmark
            • Record: found
            • Abstract: found
            • Article: found
            Is Open Access

            The effect of human mobility and control measures on the COVID-19 epidemic in China

            The ongoing COVID-19 outbreak expanded rapidly throughout China. Major behavioral, clinical, and state interventions have been undertaken to mitigate the epidemic and prevent the persistence of the virus in human populations in China and worldwide. It remains unclear how these unprecedented interventions, including travel restrictions, affected COVID-19 spread in China. We use real-time mobility data from Wuhan and detailed case data including travel history to elucidate the role of case importation on transmission in cities across China and ascertain the impact of control measures. Early on, the spatial distribution of COVID-19 cases in China was explained well by human mobility data. Following the implementation of control measures, this correlation dropped and growth rates became negative in most locations, although shifts in the demographics of reported cases were still indicative of local chains of transmission outside Wuhan. This study shows that the drastic control measures implemented in China substantially mitigated the spread of COVID-19.
              Bookmark
              • Record: found
              • Abstract: found
              • Article: found
              Is Open Access

              Incubation Period and Other Epidemiological Characteristics of 2019 Novel Coronavirus Infections with Right Truncation: A Statistical Analysis of Publicly Available Case Data

              The geographic spread of 2019 novel coronavirus (COVID-19) infections from the epicenter of Wuhan, China, has provided an opportunity to study the natural history of the recently emerged virus. Using publicly available event-date data from the ongoing epidemic, the present study investigated the incubation period and other time intervals that govern the epidemiological dynamics of COVID-19 infections. Our results show that the incubation period falls within the range of 2–14 days with 95% confidence and has a mean of around 5 days when approximated using the best-fit lognormal distribution. The mean time from illness onset to hospital admission (for treatment and/or isolation) was estimated at 3–4 days without truncation and at 5–9 days when right truncated. Based on the 95th percentile estimate of the incubation period, we recommend that the length of quarantine should be at least 14 days. The median time delay of 13 days from illness onset to death (17 days with right truncation) should be considered when estimating the COVID-19 case fatality risk.
                Bookmark

                Author and article information

                Contributors
                (View ORCID Profile)
                (View ORCID Profile)
                (View ORCID Profile)
                (View ORCID Profile)
                (View ORCID Profile)
                Journal
                Science
                Science
                American Association for the Advancement of Science (AAAS)
                0036-8075
                1095-9203
                April 27 2021
                : eabg5298
                Affiliations
                [1 ]Department of Statistics, University of Oxford, Oxford, UK.
                [2 ]Center for Communicable Disease Dynamics, Department of Epidemiology, Harvard T.H. Chan School of Public Health, Boston, MA, USA.
                [3 ]Department of Microbiology, University of Illinois at Urbana-Champaign, Urbana, IL, USA.
                [4 ]Department of Statistics, University of Illinois at Urbana-Champaign, Champaign, IL, USA.
                [5 ]Carl R. Woese Institute for Genomic Biology, University of Illinois at Urbana-Champaign, Urbana, IL, USA.
                [6 ]Department of Demography, University of California, Berkeley, CA, USA.
                [7 ]Departamento de Ecología, Facultad de Ciencias Biológicas, Pontificia Universidad Católica de Chile, Santiago, Chile.
                [8 ]Instituto de Ecología y Biodiversidad (IEB), Santiago, Chile.
                [9 ]The Santa Fe Institute, Santa Fe, NM, USA.
                [10 ]Instituto de Sistema Complejos de Valparaíso (ISCV), Valparaíso, Chile.
                [11 ]Centro de Cambio Global UC, Pontificia Universidad Católica de Chile, Santiago, Chile.
                [12 ]Computational Health Informatics Program, Boston Children’s Hospital, Boston, MA, USA.
                [13 ]Department of Pediatrics, Harvard Medical School, Boston, MA, USA.
                Article
                10.1126/science.abg5298
                08bd2c00-ff79-47a4-83b1-1bf1ac96da07
                © 2021

                https://creativecommons.org/licenses/by/4.0/

                History

                Comments

                Comment on this article