Browse
About
About UCL Open: Env.
Aims and Scope
Editorial Board
Indexing
APCs
How to cite
Publishing policies About UCL Press
Contact us
Aims and Scope
Editorial Board
Indexing
APCs
How to cite
Publishing policies About UCL Press
Contact us
For authors
Information for authors
How it works
Benefits of publishing with us
Submit APCs
Contributor agreement
How it works
Benefits of publishing with us
Submit APCs
Contributor agreement
For reviewers
My ScienceOpen
Search - Record: found
- Abstract: not found
- Book Chapter: not found
American Jewish Year Book 2019 : The Annual Record of the North American Jewish Communities Since 1899
World Jewish Population, 2019
other
Publication date (Online):
July 03 2020
Publisher:
Springer International Publishing
Read this book at
There is no author summary for this book yet. Authors can add summaries to their books on ScienceOpen to make them more accessible to a non-specialist audience.
Related collections
Most cited references339
- Record: found
- Abstract: found
- Article: found
Sequencing an Ashkenazi reference panel supports population-targeted personal genomics and illuminates Jewish and European origins
Shai Carmi, Ken Hui, Ethan Kochav … (2014)
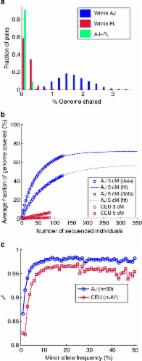
Ashkenazi Jews (AJ), identified as Jewish individuals of Central- and Eastern European ancestry, form the largest genetic isolate in the United States. AJ demonstrate distinctive genetic characteristics1 2, including high prevalence of autosomal recessive diseases and relatively high frequency of alleles that confer a strong risk of common diseases, such as Parkinson’s disease3 and breast and ovarian cancer4. Several recent studies have employed common polymorphisms5 6 7 8 9 10 11 12 13 to characterize AJ as a genetically distinct population, close to other Jewish populations as well as to present-day Middle Eastern and European populations. Previous analyses of recent AJ history highlighted a narrow population bottleneck of only hundreds of individuals in late medieval times, followed by rapid expansion12 14. The AJ population is much larger and/or experienced a more severe bottleneck than other founder populations, such as Amish, Hutterites or Icelanders15, whose demographic histories facilitated a steady stream of genetic discoveries. This suggests the potential for cataloguing nearly all founder variants in a large extant population by sequencing a limited number of samples, who represent the diversity in the founding group (for example, ref. 16). Such a catalogue of variants can make a threefold contribution: First, it will enable clinical interpretation of personal genomes in the sizeable AJ population by distinguishing between background variation and recent, potentially more deleterious mutations. Second, it will improve disease mapping in AJ by increasing the accuracy of imputation. Third, the ability to extensively sample a population with ancient roots in the Levant is expected to provide insights regarding the histories of both Middle Eastern and European populations. Here we report a catalogue of 128 high coverage, whole-genome AJ sequences. Compared with a European reference panel, the AJ panel has more novel and population-specific variants, and we demonstrate that the AJ panel is necessary for interpretation and imputation of AJ personal genomes. Analysis of long shared segments, which are abundant in AJ, confirms a recent severe bottleneck and potential utility in future sequencing studies. The joint AJ–European allele frequency spectrum suggests that the AJ population is an even mix of European and Middle Eastern ancestral populations and quantifies ancient bottlenecks and population splits. Finally, we report the deleterious mutation load in AJ to be slightly higher than in Europeans. Results We sequenced a panel (n=128) of controls of self-reported and empirically validated AJ ancestry (Supplementary Note 1; Supplementary Table 1; Supplementary Fig. 1). The high coverage sequence (>50 × ), generated by Complete Genomics17, showed multiple quality control (QC) indicators supporting both high quality and completeness of the single-nucleotide variant (SNV) data: 97% coverage of the genome (Supplementary Note 2; Supplementary Table 2), inferred discordance of 0.047% to high quality genotypes in SNP arrays (Supplementary Note 2; Supplementary Data 1), transition/transversion ratio of 2.14, and consistency of QC measures across potential sources of bias (Supplementary Note 2; Supplementary Data 2; Supplementary Figs 1 and 2). The average raw number of non-reference SNVs called per individual was 3.412 M, including 10.5K coding synonymous changes and 9.7K non-synonymous ones (Supplementary Data 2). An additional 538K multinucleotide variants, 4.1K mobile element insertions, and 302 copy number variants (spanning 6.7 Mbp) were observed, on average, in each sample (Supplementary Data 2). However, inspection of novel non-SNVs demonstrated high false-positive rates (Supplementary Note 2), and we thus focused on autosomal, bi-allelic SNVs for all subsequent analyses. We applied strict multisample filters (Supplementary Note 2) to generate a working set of 12,326,197 high quality SNVs, of which 2,891,414 were novel (23.5%; dbSNP135). Quality was gauged by a sequenced duplicate as well as runs-of-homozygosity, which are sufficiently frequent in AJ for this purpose, providing estimates of ≈6,000–8,000 false positives genome wide (Supplementary Note 2), in line with previous benchmarks of this technology17. Principal component analysis of common variants in the sequenced AJ samples confirmed previous observations5 6 9 10, namely, that AJ form a distinct cluster with proximity to other Jewish, European and Middle Eastern populations (Supplementary Fig. 1). Our reference panel is expected to improve the ability to catalogue variants and haplotypes in the Ashkenazi population, beyond what is possible with non-ancestry-matched reference samples. A natural panel for comparison would be the European samples from the 1000 Genomes Project18. However, to match the high depth of our data and the sequencing platform used to obtain it, we chose as our primary comparison data set a cohort of Flemish (FL) personal genomes (n=26) from Belgium (Supplementary Note 2). We merged our first batch of AJ genomes (n=57) with the FL data, applying a QC pipeline attempting to remove all potentially artifactual population-specific variants (Supplementary Note 2). The merged, post-QC data set included 10,499,312 SNVs for comparative analysis. Comparison of tallies of variants between AJ and FL genomes (Fig. 1a; Supplementary Table 3) suggested that AJ have slightly but significantly more overall variants (+1.5%), mostly as heterozygotes. The increased AJ heterozygosity (+2.4%), in spite of the recent bottleneck, confirms previous observations (Supplementary Note 3)6 7 10 19. More pertinently to the utility of a population sequencing endeavour, AJ samples have a much higher fraction (+47%) of novel variants (dbSNP135; Fig. 1a). Clinical AJ genomes will thus be screened more efficiently against the AJ reference panel. For example, an AJ genome has, on average, 36,995 novel variants (160 of which are also non-synonymous). Only 4.0% of them (3.2% for novel and non-synonymous) will be filtered out against the FL panel, whereas an AJ panel of the same size filters out 32.6% of variants (22.4%), 8.2 (7.0) times more. Using the entire AJ panel allows filtering of ≈65% of all novel variants (48%). The number of novel and non-synonymous, never-seen variants in an AJ personal genome is therefore only 83.3, making the clinical analysis of such a genome more feasible (Fig. 1b). The number of new variants discovered when sequencing each additional genome is slightly larger in our AJ cohort than in FL (Fig. 1c). However, extrapolation predicts the converse trend already for cohorts larger than n=49 samples (Fig. 1c; Supplementary Note 3; Supplementary Fig. 3), suggesting higher efficiency of the AJ cohort in cataloguing population variation. The effective coverage of variation can also be demonstrated using identical-by-descent (IBD) segments. We detected IBD segments by using the Germline software20, with additional filtering adapted to sequencing data (Supplementary Note 4; Supplementary Fig. 4). Sharing in AJ was ≥7.9-fold more abundant than in FL or between the populations (Fig. 2a). Using the AJ panel, one can cover at least one haplotype in ≈67% of the genome of any other AJ individual with long (>3 cM) IBD segments (≈46% using segments>5 cM), compared with much poorer efficiency in Europeans (Fig. 2b; here we used the CEU panel from the 1000 Genomes project; Supplementary Note 4). These results imply that any additional, sparsely genotyped AJ sample can be effectively imputed, at least partially, along haplotypes shared with a small sequenced reference panel. Co-ancestry of copies of IBD segments is expected to be extremely recent (typically 30 or fewer generations), thus allowing only very recent mutations to be missed at the imputed genome21 22. Whether this strategy will scale for the accurate imputation of the entire genome of an AJ proband will be resolved with the sequencing of additional genomes. Our sequencing panel is also expected to improve the performance of traditional imputation approaches, which are known to be more accurate when the ancestries of the reference and target populations are matched23. To evaluate the quality of imputation, we divided our sequencing cohort into ‘reference’ and ‘study’ panels; in the latter, we masked all variants not genotyped on a typical SNP array. We then imputed24 the ‘study’ panel using either our ‘reference’ panel (n=50) or the larger (n=87) 1000 Genomes CEU panel18 (Supplementary Note 5; Supplementary Fig. 5). As expected, using an AJ reference panel was more accurate than using a European one, with the number of discordant genotypes 28% lower and the correlation between true and imputed dosages, r 2, increasing from 97.4% to 98.2% (Supplementary Note 5; Supplementary Table 4). Using the AJ panel reduced mostly the number of false negatives (with respect to the reference genome; Supplementary Table 4); it lowered the number of wrongly imputed non-reference variants with minor allele frequency ≤1% by 2.7-fold, with the improvement remaining at 1.5–2-fold at higher frequencies (Fig. 2c; Supplementary Fig. 6). This improvement in imputation quality likely reflects both the increased segmental sharing in AJ as well as the large number of AJ-specific alleles. These results motivate using a population-matched, rather than a merely continent-matched, reference panel, even for the closely related AJ and European populations. Our sequencing data also enables detailed reconstruction of AJ and European population histories. Allele frequency spectra (AFS) are attractive conduits for such an analysis, especially in deeply sequenced cohorts. The AFS of both AJ and FL (Fig. 3a) reject a constant-size population model, which has previously been ruled out across multiple human populations25. The two spectra are similar, with AJ showing a slight excess of doubletons. These spectra each fit well to similar models of ancient history, comprising an ancient bottleneck (≈60–86 Kyr) followed by slow exponential growth (Supplementary Note 6; Supplementary Table 5; Supplementary Fig. 7; Supplementary Fig. 8). The joint (AJ–FL) AFS reveals correlated allele counts (Fig. 3b), indicating gene flow between the populations or very recent divergence (Supplementary Note 6). Yet, correlation is not as strong as it would have been had the AJ–FL combined sample been panmictic (Fig. 3b; FST=0.016; Supplementary Note 6). The normalized AFS of population-specific variants (Fig. 3a, inset) is noticeably different between AJ and FL, with higher allele frequencies in AJ. There were overall 14% more population-specific variants in AJ (Supplementary Note 6; Supplementary Figs 9 and 10), pointing to asymmetric gene flow from Europeans into the ancestral population of AJ. We next turned to inferring an explicit model for the demographic history of AJ and Europeans. Since the allele frequency spectrum, in particular for our sample size, may not be sensitive to recent demographic events, we first reconstructed the very recent AJ history by examining long IBD segments5 12 14 21, which carry information on recent co-ancestry (last ≈50 generations). We used the lengths of shared segments (Fig. 3c) to infer the parameters of a recent AJ bottleneck (effective size 250–420; 25–32 generations ago) followed by rapid exponential expansion (rate per generation 16–53%; Fig. 4, bottom), confirming previous analyses conducted on lower throughput data (Supplementary Note 4; Supplementary Table 6; Supplementary Fig. 11)12 14. Given the model for the recent AJ history, we inferred the parameters of a model for the ancient history of AJ and FL using an existing method (∂a∂i 26) based on the joint frequency spectrum (Supplementary Note 6; Supplementary Data 3). Confidence intervals were computed using parametric bootstrap26 (Supplementary Note 6), but we did not integrate over the uncertainty in the mutation rate (see the next paragraph). According to the resulting model (Fig. 4, top; Supplementary Table 7; Supplementary Fig. 12), contemporary AJ formed 600–800 years (close to the time of the AJ bottleneck) as the fusion of two ancestral populations. One ancestral population, consistent with being the ancestors of the FL samples, contributed 46–50% of the AJ gene pool. We call that population ancestral European and the other ancestral Middle Eastern. The ancestral European population went through a founding bottleneck (effective size 3,500–3,900) when diverging from ancestral Middle Easterners. We date this event to 20.4–22.1 Kyr, at around the time of the Last Glacial Maximum and preceding the Neolithic revolution (27; see Supplementary Note 6 and below for discussion). The ancestors of both populations underwent a bottleneck (3,600–4,100 founders) at 85–94 Kyr, likely corresponding to an Out-of-Africa event28. The confidence intervals around our inferred parameters were remarkably small (Supplementary Table 7; coefficient of variation typically ≈2–5% and no more than ≈8%). However, any sampling noise in our historical reconstruction is negligible compared with possible inaccuracies in the human mutation rate or potentially oversimplified model assumptions. We verified that our main conclusions were robust to variations in the model’s fine details (Supplementary Note 6). Conversely, all inferred times and population sizes depend inversely on the mutation rate, μ, and are thus highly sensitive to its precise value. The recent debate over the human mutation rate28 29 has converged to estimates of μ ranging between 1.0–1.5·10−8 (per generation per bp; obtained using next-generation sequencing of de novo mutations), compared with the traditional estimates (using the human–chimpanzee divergence) around μ phylo≈2.5·10−8. The mutation rate that we used was μ=1.44·10−8, estimated by Gravel et al. 30 by matching the relatively well-known time of the population of the Americas with the time of a bottleneck inferred from Native American whole-genome sequences. This estimate is relevant to our evolutionary time scale of interest, and is close to the ‘de novo’ estimates31 (see ref. 32 for a very recent review). Previous explicit demographic models using genome-wide SNP arrays or low-pass sequencing data time-stamped a European bottleneck at ≈40–80 Kyr (recalibrated to the lower mutation rate estimate; Supplementary Note 6), with even the lowest estimates26 33 34 being higher than our point estimate of ≈21 Kyr. However, no previous study has employed deeply sequenced genomes of (partial) Middle Eastern ancestry; in addition, previous studies usually modelled the European founder event simultaneously with the divergence from East Asian populations. As modern humans had colonized Europe already by ≈40–45 Kyr35, our results (across all estimates of the mutation rate) support genetic discontinuity between that (hunter–gatherer) population and contemporary Europeans. A Middle Eastern European divergence time around ≈21 Kyr would also suggest (i) a near Eastern source for the repopulation of Europe at the end of the Last Glacial Maximum27 36 and (ii) that migration from the Middle East to Europe largely preceded the Neolithic revolution, suggesting that Neolithic population movements were largely within Europe37 38 39 40 41 42. These interpretations, however, strongly depend on the mutation rate: taking into account the uncertainty in the mutation rate, our divergence time estimate is between ≈12–25 Kyr, which can be reconciled with Neolithic migrations originating in the Middle East (Supplementary Note 6). We finally turned to the analysis of the functional elements of the genome. Historically, mapping disease mutations in the AJ population enabled the development of diagnostic panels. Here, our sequencing data allowed us to generate an extensive listing of variants in such genes (Supplementary Data 4, which also demonstrates the detection of carriers for 35 known disease mutations; Supplementary Note 7). Recently, it was suggested that relaxation of negative selection constraints in bottlenecked populations increases their deleterious mutational burden43 44 45. We therefore looked for patterns of selective constraints at likely functional sites, taking advantage of the availability of non-coding regions as a control. We used again the platform-matched FL samples as a comparison cohort. As expected due to purifying (negative) selection, variants of increasing functional importance appear in lower frequencies in both AJ and FL, but not significantly differently between the populations (Supplementary Note 7; Supplementary Figs 13 and 14). A comparison of the functional mutation load showed slightly increased load in AJ compared with FL (Supplementary Note 7; Supplementary Table 8), consistently with the bottleneck hypothesis. Specifically, the observed number of non-reference, non-synonymous variants in AJ was 0.50% higher than expected based on population differences in neutral variation (P=0.006; Supplementary Note 7; see also Supplementary Fig. 15). We note, however, that the effect is weak and the significance is sensitive to the precise definition of deleterious variation (Supplementary Note 7). A genome-wide GERP analysis similarly showed that AJ variants overlap with slightly more conserved sites (P=0.01; Supplementary Note 7). In conclusion, we observed increased deleterious mutation load in AJ, but the effect is very limited, compared, for example, with French Canadians43. Ongoing progress in theory (for example, ref. 46) and data analysis methods is expected to elucidate this difference as well as lead to more decisive results for the AJ load. Finally, as a number of diseases show higher prevalence in AJ1, we sought to determine whether there are specific disease categories overabundantly affected by non-synonymous variation47 (Supplementary Note 7). While a few categories showed higher mutational load than others (Supplementary Table 9), none reached false discovery rate 50 × , in three batches (Supplementary Note 1). QC and processing pipeline Raw sequencing summary statistics are reported per sample and per batch in Supplementary Data 2. Copy number variants and mobile element insertions were also reported; however, the false-positive rate was high (see below and Supplementary Note 2). All samples were previously genotyped on SNP arrays; concordance was measured using CGA tools and averaged 99.67% over all samples. The discordance was correlated with the array missingness, but not with sequencing metrics; extrapolating to the limit of no array missingness, the discordance approached 0.047% (Supplementary Note 2). Genotypes calls across individuals were merged using CGA tools and converted to VCF or Plink 55 formats. Some of the analyses were carried out on 57 genomes sequenced in the first batch. Otherwise, we used the entire cohort (n=128). The merged genotypes were filtered by removing low quality and half-called variants, multiallelic and multinucleotide variants, variants not called as non-reference in any genome, variants with a no-call rate >10% (6% for the first batch), variants not in Hardy–Weinberg equilibrium (P 50%). We suspected that those variants were due to reference genome mapping discrepancy (hg18/hg19), which we confirmed using Complete Genomics’ public genomes resource (Supplementary Note 3). We therefore removed from further analysis ≈4,000 population-specific variants with frequency >25%. To facilitate population-genetic comparisons, we downsampled the joint spectrum to 50 AJ and 50 FL haploid genomes analytically using hypergeometric expectations. We folded and marginalized the spectrum using standard definitions (Supplementary Note 3; minor alleles were defined with respect to the combined sample; Fig. 3b). The Wright–Fisher expected spectrum (Fig. 3a) was computed using standard coalescent theory61. The panmictic spectrum of Fig. 3b was computed analytically assuming that the appearances of each variant are randomly distributed between AJ and FL (Supplementary Note 3). FST was computed using ∂a∂i 26. IBD segment detection To detect IBD segments, we first assigned genetic map distances using HapMap2 (ref. 63). We then ran Germline20 using a minimal length cutoff of either 3 cM or 5 cM, and in the ‘genotype extension’ mode12, which allows segments to extend as long as double homozygous sites are matching. We followed by filtering segments with particularly short physical length, overlap with sequence gaps or where all matching sites had the major allele. We further filtered segments by computing a score related to the probability of a segment to be truly shared-by-descent, on the basis of the allele frequencies of sites along the segment (Supplementary Note 4). Scores were higher for within-AJ segments than for within-FL or AJ–FL segments (Supplementary Fig. 4). In addition, most non-AJ sharing was concentrated in a handful of peaks (Supplementary Note 4), suggesting that many of the non-AJ detected segments were false positives. Coverage of the genome by IBD segments To create Fig. 2b, we considered sharing within-AJ (using all 128 individuals) and within-Europeans (FL or CEU from the 1000 Genomes Project) separately. For each hypothetical reference panel size n, we created a subset of size n of the full panel. For each individual in the subset, we computed the fraction of the genome (in physical distance) shared between that individual and the rest of the subset (which implies sharing of at least one of the haplotypes, but not necessarily both). We then averaged over all individuals in the subset and over 50 random subsets. The coverage curve was fitted to the expectation from a simple model of a bottleneck lasting a single generation, with the population size being extremely large otherwise (Supplementary Note 4). Demographic inference using IBD segments We used the method developed in ref. 14. For each segment length bin, we summed the total length (in cM) of segments having length in the bin and divided by the total genome size and by the total number of (haplotype) pairs. The resulting curve (Fig. 3c) was fitted (by a grid search, minimizing the sum of squared (log-) errors) to a bottleneck and expansion model, with theoretical curves computed as in ref. 14. The constant population size estimator was computed as in ref. 21. The fitting error around the optimal parameters (Supplementary Fig. 11) showed deep minima around the optimal bottleneck time and population size, but less confidence in the values of the ancestral population size and the growth rate. Confidence intervals were obtained using jackknifing (Supplementary Table 6; Supplementary Note 4). Parametric bootstrap gave qualitatively similar results. Imputation accuracy using the AJ panel We split the 57 AJ genomes of the first batch (here phased using a variation of SHAPEIT that employs molecular phasing information (Supplementary Note 2)) into a reference panel (n=50) and a study panel (n=7). We reduced the study panel sequences to SNPs typically genotyped on an Illumina Human Omni1-Quad array, and supplemented them with 1000 SNP arrays of AJ controls from a Schizophrenia study11 48, to emulate a typical imputation scenario. After standard QC procedures (Supplementary Note 5), we phased the entire study panel (n=1007) using SHAPEIT. We then imputed the study panel, on the basis of the AJ reference panel, using IMPUTE2 (ref. 64). We also imputed using the CEU reference panel from 1000 Genomes (n=87, larger than the AJ panel). We carried out all analyses on chr1 only (Supplementary Note 5). Imputation accuracy was measured by uncovering the full sequences of the AJ study genomes (Supplementary Table 4). Sites not imputed by the CEU panel were set as homozygous reference, and sites imputed by the CEU panel that were not found in the AJ sequences were (conservatively) discarded (Supplementary Note 5). Monomorphic non-reference sites in the AJ panel were also discarded. The squared correlation coefficient, r 2 , was computed between the aggregate of all true genotypes (over all sites and study individuals) and all imputed dosages. Due to our small study panel, we computed the minor allele frequency (plotted in Fig. 2c and Supplementary Fig. 6) in the AJ reference panel (n=50). We excluded variants with frequency zero from these plots (leaving finally ≈200K variants per individual), since they are necessarily wrongly imputed. They were not removed from the overall accuracy reports (Supplementary Table 4). Demographic inference using the allele frequency spectrum We inferred the parameters of demographic models using ∂a∂i 26. For all models, we used a mutation rate of 1.44 × 10⁻⁸ per bp per generation30 (based on the time of the human settlement in the Americas) and set the genome length to 2.685 × 10⁹ (autosomal hg19, excluding sequence gaps) times 0.81, which is an estimate of the fraction of variants remaining after cleaning (Supplementary Note 6). We estimated the scaled mutation rate, θ, by matching the number of segregating sites. The generation time we used was 25 years. We inferred single-population models using the individual AJ and FL spectra as well as two-population models using the joint spectrum (downsampled to 50 × 50 haploid genomes). In each case, the spectrum was fitted, using ∂a∂i, with parameters as recommended by the authors (Supplementary Note 6). For each model, we experimented with different parameter regions until identifying a plausible parameter set. We then initiated the parameters to randomly perturbed values around that set. We repeated optimization with 100 different initial conditions and reported the most likely parameters. We verified that these parameters were not close to the optimization boundaries and not sensitive to the initial perturbation. Parametric bootstrap was carried out by simulating (using MaCS 65, a coalescent simulator) artificial genomes under the demographic model of the most likely parameter set. For each of 100 data sets, the allele frequency spectrum was computed and folded, and ∂a∂i was used to infer the demographic parameters, exactly as for the real data. The biased-corrected 95% confidence intervals were computed assuming a normal distribution of the inferred parameters (Supplementary Note 6). Note that the confidence intervals account only for sampling noise but not for systematic errors such as sequencing errors or model and mutation rate misspecification. For the single-population case (Supplementary Note 6, Supplementary Fig. 7 and Supplementary Table 5), we found that a model of a bottleneck followed by exponential growth explains well the spectra of both populations (Supplementary Fig. 8). Our main two-population model is shown in Fig. 4. The parameters of the recent AJ bottleneck were fixed to the values inferred from the IBD analysis (Supplementary Table 6). We verified that the log-likelihood of the optimal model decreased sharply near the values of two key parameters: the fraction of European admixture into AJ and the time of the European–Middle Eastern divergence. Admixture into AJ was shown to be necessary for a reasonable fit (Supplementary Note 6). Most parameters were robust to model specification, specifically, the time of the out-of-Africa bottleneck, the fraction of European admixture into AJ, and to some extent, the European–Middle Eastern divergence time. The time of the European admixture, however, differed considerably between models (Supplementary Note 6). The most promising model refinement included an additional wave of migration from the ancestral Middle Eastern population into Europeans at about ≈17 Kyr; experiments with further refinements did not converge to a consistent parameter set (Supplementary Note 6). The deleterious mutation load We annotated coding variants in the merged and size-matched AJ–FL data set (n=26 × 2) using the SeattleSeq Variant Annotation server. We measured the (non-reference) variant load either as unique or total counts, and either for all or low frequency only variants (Supplementary Note 7). We further broke the counts by whether the variants were non-coding, coding synonymous or coding non-synonymous, and by PolyPhen’s66 predicted effect (damaging or benign). To account for the genome wide larger number of variants in AJ, we normalized all counts by the ratio between the number of neutral AJ and FL variants. Significance of AJ–FL differences in any category was evaluated by assuming that all counts were binomial (Supplementary Table 8; Supplementary Note 7). To compare the number of non-synonymous variants per individual (Supplementary Fig. 15), we normalized each count by the number of intergenic variants. The (genome wide) average GERP score over all non-reference variants in each individual67 was slightly higher (more conserved) in AJ than in FL (Supplementary Note 7). We also attempted to determine whether there was any disease category with particularly high mutational burden in AJ. We computed the total number (over all individuals in each population) of non-synonymous (non-reference) variants in all genes belonging to each disease category, using the annotation developed in ref. 47 and then by Omicia (assigning 2488 genes into 17 categories; Supplementary Table 9). We then ranked all genes according to the difference between the number of AJ and FL non-synonymous variants, and used GSEA68 to determine whether any given category had an exceptional number of top ranked genes. Only the aging category reached P 0.05 (Supplementary Note 7). A catalogue of variants in known disease genes Our list of AJ disease genes is based on a table from ref. 2. We determined the hg19 coordinates of all disease mutations in that table manually using a number of online resources (Supplementary Note 7). The final list of 73 mutations in 48 genes is reported in Supplementary Data 4, along with some properties of each mutation. We then extracted all variants (including non-SNVs) in these genes from our unfiltered AJ genotypes (n=128). We detected carriers of 35 known disease mutations in 29 genes and annotated 953 newly discovered variants (using ANNOVAR 60; also reported in Supplementary Data 4, along with summary statistics per gene; Supplementary Note 7). Author contributions S.C. was the primary analysis and manuscript-writing person. K.Y.H., E.K., X.L., J.X., F.G., S.G., K.U., D.B.-A., S.M., B.M.B., T.T. and J.V. conducted analysis and provided input for the manuscript. M.C., G.F., D.L., S.P., C.V.B, P.V.D., and H.V.M. contributed the Flemish genomes. N.B. contributed Ashkenazi DNA samples. A.D., K.O., S.B., I.Peter, J.H.C., H.O., L.J.O., G.A., L.N.C., T.L., and I.Pe’er initiated and funded the study. I.Peter, J.H.C., H.O., G.A., L.N.C., and T.L. supervised analysis and provided comments on the manuscript. G.A. and L.N.C. conducted lab work. T.L. led the funding of the study. I.Pe’er led the analysis and the writing of the manuscript. Additional information Accession codes: Whole-genome sequence data have been deposited at the European Genome-phenome Archive, which is hosted by the EBI, under accession code EGAS00001000664. How to cite this article: Carmi, S. et al. Sequencing an Ashkenazi reference panel supports population-targeted personal genomics and illuminates Jewish and European origins. Nat. Commun. 5:4835 doi: 10.1038/ncomms5835 (2014). Supplementary Material Supplementary Information Supplementary Figures 1-15, Supplementary Tables 1-9, Supplementary Notes 1-8 and Supplementary References Supplementary Data 1 Concordance of the sequencing genotypes with SNP arrays. Supplementary Data 2 Collection and analysis of the quality control and variant count statistics as reported by Complete Genomics. The dataset also contains a comparison of the distribution of the statistics in each sequencing batch. Supplementary Data 3 The joint AJ-Flemish allele frequency spectrum, after both cohorts have been down-sampled to 25 genomes each. Supplementary Data 4 A list of known disease mutations in Ashkenazi Jews and their frequencies in our panel. The dataset also includes a list of previously unknown mutations in the disease genes and their counts by gene and functional category.
- Record: found
- Abstract: found
- Article: found
The Genetic Legacy of Religious Diversity and Intolerance: Paternal Lineages of Christians, Jews, and Muslims in the Iberian Peninsula
Susan M Adams, Elena Bosch, Patricia BALARESQUE … (2008)
Most studies of European genetic diversity have focused on large-scale variation and interpretations based on events in prehistory, but migrations and invasions in historical times could also have had profound effects on the genetic landscape. The Iberian Peninsula provides a suitable region for examination of the demographic impact of such recent events, because its complex recent history has involved the long-term residence of two very different populations with distinct geographical origins and their own particular cultural and religious characteristics—North African Muslims and Sephardic Jews. To address this issue, we analyzed Y chromosome haplotypes, which provide the necessary phylogeographic resolution, in 1140 males from the Iberian Peninsula and Balearic Islands. Admixture analysis based on binary and Y-STR haplotypes indicates a high mean proportion of ancestry from North African (10.6%) and Sephardic Jewish (19.8%) sources. Despite alternative possible sources for lineages ascribed a Sephardic Jewish origin, these proportions attest to a high level of religious conversion (whether voluntary or enforced), driven by historical episodes of social and religious intolerance, that ultimately led to the integration of descendants. In agreement with the historical record, analysis of haplotype sharing and diversity within specific haplogroups suggests that the Sephardic Jewish component is the more ancient. The geographical distribution of North African ancestry in the peninsula does not reflect the initial colonization and subsequent withdrawal and is likely to result from later enforced population movement—more marked in some regions than in others—plus the effects of genetic drift.
Author and book information
Book Chapter
Publication date
(Print):
2020
Publication date
(Online):
July
03 2020
Pages: 263-353
DOI: 10.1007/978-3-030-40371-3_8
SO-VID: 8bcf40da-73c8-4a63-bff8-24840da98029
History
Data availability: