- Record: found
- Abstract: found
- Article: found
Application of a Tool to Identify Undiagnosed Hypertension — United States, 2016
research-article
Elizabeth L. Ciemins , PhD
1
,
,
Matthew D. Ritchey , DPT
2 ,
Vaishali V. Joshi
1 ,
Fleetwood Loustalot , PhD
2 ,
Judy Hannan , MPH
2 ,
John K. Cuddeback , MD
1
27 July 2018
Read this article at
There is no author summary for this article yet. Authors can add summaries to their articles on ScienceOpen to make them more accessible to a non-specialist audience.
Abstract
Approximately 11 million U.S. adults with a usual source of health care have undiagnosed
hypertension, placing them at increased risk for cardiovascular events (
1
–
3
). Using data from the National Health and Nutrition Examination Survey (NHANES),
CDC developed the Million Hearts Hypertension Prevalence Estimator Tool, which allows
health care delivery organizations (organizations) to predict their patient population’s
hypertension prevalence based on demographic and comorbidity characteristics (
2
). Organizations can use this tool to compare predicted prevalence with their observed
prevalence to identify potential underdiagnosed hypertension. This study applied the
tool using medical billing data alone and in combination with clinical data collected
among 8.92 million patients from 25 organizations participating in American Medical
Group Association (AMGA) national learning collaborative* to calculate and compare
predicted and observed adult hypertension prevalence. Using billing data alone revealed
that up to one in eight cases of hypertension might be undiagnosed. However, estimates
varied when clinical data were included to identify comorbidities used to predict
hypertension prevalence or describe observed hypertension prevalence. These findings
demonstrate the tool’s potential use in improving identification of hypertension and
the likely importance of using both billing and clinical data to establish hypertension
and comorbidity prevalence estimates and to support clinical quality improvement efforts.
This study used medical billing
†
and electronic health record (EHR) clinical data collected among 8.92 million patients,
aged 18–85 years, who had ≥1 ambulatory office visit for evaluation and management
in 2016 within one of 25 AMGA-member organizations. These organizations use the Optum
One population health analytic tool
§
and pool billing and clinical data as part of a national learning collaborative.
Observed hypertension prevalence was defined using three case definitions that use
increasing amounts of billing and clinical data collected during the observation year.
The first hypertension case definition included patients with at least one diagnosis
code for hypertension
¶
on a billing claim. Patients without a diagnosis code on a billing claim, but who
had a diagnosis code for “hypertension” on their EHR problem list** met the hypertension
criteria for the second case definition. Additional patients were added who did not
meet criteria for the first two case definitions, but who had elevated in-office blood
pressure (BP) readings, defined as a single reading ≥160/100 mm Hg or two readings
on different days ≥140/90 mm Hg. The first and second case definitions reflect documented
diagnoses of hypertension. The BP criteria in the third case definition align with
national recommendations for diagnosing hypertension
††
; however, patients who meet this definition alone are not considered to have a hypertension
diagnosis and might not have hypertension upon further assessment.
Predicted hypertension prevalence was determined by applying the Hypertension Prevalence
Estimator Tool to the organizations’ data; development and validation of the tool
are described elsewhere (
2
). The tool requires input of the patient population’s demographic characteristics
(i.e., distribution by sex, race/ethnicity, and age group) with the option
§§
of providing the prevalence of three comorbidities within the patient population that
aid in predicting hypertension prevalence (i.e., the presence of none, one, or two
or more of the following conditions: obesity, diabetes, and chronic kidney disease).
Similar to identifying hypertension, comorbidities were identified during the observation
year using 1) medical billing claims only
¶¶
; 2) problem list diagnosis codes; or 3) other clinical data.***
The observed hypertension prevalence and the 95% confidence intervals of the predicted
hypertension prevalence, calculated with and without use of organization-specific
information on comorbidity prevalence, were compared overall and by organization using
each case definition.
A total of 8.92 million patient records were included, with patient populations ranging
from 50,000 to 1.02 million across the 25 organizations. Nearly 40% of patients were
aged 45–64 years; 57% were female, and 74% were non-Hispanic white (range = 47%–90%)
(Table 1). Overall, 5.9% of patients with ≥1 office visit during 2016 had no BP reading
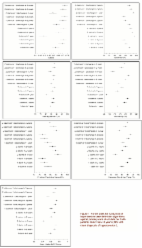
recorded (range = 0.3%–15.9%) (Supplementary Figure, https://stacks.cdc.gov/view/cdc/54153).
TABLE 1
Patient characteristics of 25 health care delivery organizations participating in
application of Million Hearts Hypertension Prevalence Estimator Tool — United States,
2016
Characteristic
Overall population
Range
No. of patients included in analyses,* millions
8.92
0.05–1.02
Age group (yrs), %
18–44
34.2
25.6–39.4
45–64
39.5
36.1–42.6
65–74
16.9
13.8–22.9
75–85
9.4
7.4–14.7
Sex, %
Women
57.3
52.6–61.1
Men
42.7
38.9–47.4
Race/Ethnicity %
White, non-Hispanic
73.9
46.9–90.3
Black, non-Hispanic
7.1
0.4–20.2
Hispanic
3.4
0.7–9.4
Other
10.5
1.7–34.9
Missing
5.1
0.4–15.0
*Aged 18–85 years with a least one ambulatory care visit during 2016.
Comorbidity prevalence and predicted and observed hypertension prevalence varied overall
and by organization depending on the evidence used (Table 2) (Table 3) (Supplementary
Figure, https://stacks.cdc.gov/view/cdc/54153). Overall obesity prevalence increased
from 10.7% using billing data alone to 45.0% using all three data sources (Table 2).
Use of billing data alone indicated that 4.4% of patients had 2–3 comorbidities; the
addition of problem list data alone and in combination with other clinical data increased
detection of 2–3 comorbidities to 5.7% and 14.3%, respectively. Prevalence of 2–3
comorbidities ranged from 8.3% to 18.1% across organizations using all three data
sources.
TABLE 2
Variation in observed and predicted hypertension prevalence with increasing levels
of medical billing and clinical data used, overall and across health care delivery
organizations (HDOs) (n = 8.92 million) participating in application of Million Hearts
Hypertension Prevalence Estimator Tool — United States, 2016
Prevalence
Overall total
Range across HDOs*
Claims
Claims or problem list
Claims with problem list and clinical criteria
Claims
Claims or problem list
Claims with problem list and clinical criteria
Comorbidity prevalence, %
Obesity
10.7
13.1
45.0
4.6 to 34.7
7.2 to 35.2
29.6 to 51.4
Diabetes
11.3
12.9
16.4
6.0 to 13.8
6.8 to 17.5
9.2 to 21.8
Chronic kidney disease
3.4
4.4
7.4
1.2 to 5.2
1.4 to 6.3
3.6 to 9.3
Combined prevalence of the above conditions
0 conditions
79.4
76.2
48.3
59.6 to 86.5
58.2 to 84.4
41.5 to 63.7
1 condition
16.3
18.1
37.5
11.2 to 31.5
12.8 to 32.5
27.4 to 42.4
2–3 conditions
4.4
5.7
14.3
2.3 to 8.9
2.8 to 9.3
8.3 to 18.1
Hypertension prevalence
Observed, %
29.1
30.0
36.0
17.1 to 35.4
18.3 to 37.8
24.2 to 46.1
No. (millions)
2.60
2.68
3.21
0.02 to 0.05
0.02 to 0.06
0.03 to 0.07
Predicted† using organization-specific comorbidity data, % (95% CI)
33.2 (33.2–33.3)
33.9 (33.9–34.0)
39.5 (39.5–39.5)
30.2 to 40.1
30.9 to 41.4
35.5 to 47.6
Percentage point difference,§ (95% CI)
4.1 (4.1–4.2)
3.9 (3.9–4.0)
3.5 (3.5–3.6)
0.0 to 14.7
0.4 to 13.9
1.0 to 13.8
No. of additional patients identified
366,000
348,000
312,000
24 to 65,000
731 to 67,100
267 to 57,700
Predicted† not using organization-specific comorbidity data,¶ % (95% CI)
38.5 (38.5–38.6)
38.5 (38.5–38.6)
38.5 (38.5–38.6)
35.4 to 46.2
35.4 to 46.2
35.4 to 46.2
Percentage point difference,§ (95% CI)
9.4 (9.4–9.5)
8.5 (8.5–8.6)
2.5 (2.5–2.6)
-21.1 to 4.0
-19.9 to 2.8
-14.0 to 2.8
No. of additional patients identified
838,000
758,000
223,000
2,910 to 119,000
1,770 to 114,000
130 to 57,800
Abbreviation: CI = confidence interval.
* Range of values calculated across the 25 health care delivery organizations participating
in the American Medical Group Association's national learning collaborative; 95% CIs
are not provided for the predicted hypertension prevalence estimates.
† Based on Million Hearts Hypertension Prevalence Estimator Tool.
§ Compared with observed prevalence. Observed prevalence was always less than predicted
prevalence.
¶ The comorbidity profile of the health care delivery organization’s patient population
is estimated using National Health and Nutrition Examination Survey databased on the
organization’s patient population’s age, gender, and race/ethnicity characteristics.
TABLE 3
Observed and predicted prevalence of hypertension among the American Medical Group
Association's member health care delivery organizations — United States, 2016
Organization
Medical claims only*
Medical claims plus problem list*
Medical claims plus problem list plus clinical data*
Based on national comorbidity estimates†
Observed§
Predicted¶
Observed§
Predicted¶
Observed§
Predicted¶
Predicted¶
1
35.4%
40.1%
37.8%
41.4%
46.1%
47.6%
46.2%
2
34.9%
38.5%
35.5%
38.9%
44.3%
44.6%
43.9%
3
34.6%
39.0%
37.0%
39.3%
40.4%
42.4%
40.7%
4
34.2%
34.2%
35.4%
35.0%
41.0%
40.0%
38.2%
5
31.9%
32.4%
32.3%
33.3%
39.3%
40.4%
37.9%
6
31.8%
33.6%
32.6%
34.3%
40.7%
40.1%
38.0%
7
31.4%
34.2%
31.4%
35.0%
38.5%
41.1%
40.8%
8
30.5%
31.5%
30.7%
32.2%
34.9%
36.8%
36.1%
9
30.1%
35.9%
31.5%
36.7%
37.5%
42.2%
40.6%
10
29.6%
35.0%
30.9%
35.3%
38.5%
39.8%
39.1%
11
28.9%
31.1%
29.9%
31.7%
36.8%
38.6%
36.3%
12
28.6%
32.5%
29.2%
33.3%
33.8%
38.4%
37.9%
13
28.5%
32.6%
29.8%
33.5%
34.7%
39.3%
38.1%
14
28.4%
32.3%
29.9%
32.9%
39.3%
40.0%
38.4%
15
28.4%
34.0%
32.9%
34.9%
37.3%
40.8%
39.5%
16
28.3%
30.9%
29.7%
31.7%
33.6%
37.1%
35.4%
17
28.3%
35.4%
28.8%
36.2%
35.0%
41.3%
41.3%
28
28.0%
35.3%
28.9%
35.9%
33.2%
40.0%
41.4%
19
27.5%
30.2%
27.7%
30.9%
33.8%
37.0%
35.9%
20
27.5%
32.9%
28.6%
33.7%
33.5%
39.3%
38.0%
21
24.7%
34.0%
27.2%
34.4%
35.7%
40.7%
39.9%
22
24.5%
32.4%
25.7%
32.7%
30.7%
37.1%
37.5%
23
24.2%
33.1%
24.3%
33.7%
31.4%
39.3%
38.4%
24
22.2%
31.4%
22.7%
31.8%
26.5%
35.5%
37.8%
25
17.1%
31.8%
18.3%
32.2%
24.2%
38.0%
38.2%
* Observed prevalence of the three comorbidities within the organizations’ patient
population is used to predict hypertension prevalence. Comorbidities were identified
based on: 1) “medical claims only”: at least one diagnosis code for the condition
on an outbound billing claim (International Classification of Disease, Tenth Revision,
Clinical Modification [ICD-10-CM] code of E66.09, E66.1, E66.8, E66.9, E66.01, E66.2,
Z68.3X, Z68.4X, Z68.54, or R93.9 for obesity; E10.X or E11.X for diabetes; and I12.X,
I13.X, or N18.X for chronic kidney disease); 2) “medical claims plus problem list”:
adds additional patients who had a diagnosis code for obesity, diabetes, or chronic
kidney disease on their electronic health record (EHR) problem list (same codes as
designated for claims); and 3) “medical claims plus problem list & clinical data”:
adds additional patients who had a body mass index ≥30 kg/m2 for obesity; hemoglobin
A1c of ≥6.5%, plasma glucose of ≥126 mg/dL, fasting plasma glucose of ≥126 mg/dL,
or a glucose tolerance test of ≥200 mg/dL for diabetes; and an estimated glomerular
filtration rate of <60 mL/min per 1.73 m2 for chronic kidney disease.
† Predicted prevalence of the three comorbidities within the organizations’ patient
population is used to predict hypertension prevalence. Predicted comorbidity prevalence
is estimated based on the organization population prevalence of age, gender, and race/ethnicity
characteristics and use of National Health and Nutrition Examination Survey data.
Using this method does not affect the observed hypertension prevalence; therefore,
no observed prevalence values are provided.
§ Defined using: 1) “medical claims only”: at least one diagnosis code for hypertension
on an outbound billing claim ( ICD-10-CM code of I10, I11.X, I12.X, or I13.X); 2)
“medical claims plus problem list”: adds additional patients who had a diagnosis code
for “hypertension” on their EHR problem list (same codes as designated for claims);
and 3) “medical claims plus problem list & clinical data”: adds additional patients
who had elevated in-office blood pressure readings, defined as a single reading ≥160/100
mm Hg or two readings on different days ≥140/90 mm Hg.
¶
Determined by applying the Million Hearts Hypertension Prevalence Estimator Tool to
the organizations’ data. The predicted hypertension prevalence is estimated based
on the distribution of patients by age, gender, race/ethnicity, and predicted or diagnosed
comorbidity prevalence (presence of 0, 1, or 2–3 of the following conditions: obesity,
diabetes and chronic kidney disease).
With the addition of each data source to identify hypertension and the comorbidities,
overall observed hypertension prevalence increased from 29.1% to 30.0% to 36.0% (range = 2.60–3.21
million patients), and overall predicted hypertension prevalence increased from 33.2%
to 33.9% to 39.5% (range = 2.96–3.52 million patients), respectively (Table 2) (Table
3) (Supplementary Figure, https://stacks.cdc.gov/view/cdc/54153). Differences between
the estimates for observed and predicted hypertension prevalence ranged from 3.5 to
4.1 percentage points, representing a range of 312,000 to 366,000, or one in eight
to one in 11 patients who potentially have undiagnosed hypertension. Across the 25
organizations, observed hypertension prevalence ranged from 24.2% to 46.1%, predicted
hypertension prevalence ranged from 35.5% to 47.6%, and the difference between the
two ranged from 1.0 to 13.8 percentage points, with predicted prevalence always higher
than observed prevalence.
Removing organization-specific comorbidity data from the information used to predict
hypertension prevalence and relying on the NHANES-based comorbidity estimates provided
in the Estimator Tool resulted in an overall predicted hypertension prevalence of
38.5% and increased the difference between observed and predicted prevalence from
2.5 to 9.4 percentage points, depending on the data sources used to identify hypertension
(Table 2).
Discussion
Application of the Million Hearts Hypertension Prevalence Estimator Tool using billing
and clinical data collected from approximately 9 million U.S. adult patients within
multispecialty medical groups and integrated systems across the country revealed that
up to one in eight patients with hypertension might not have received a diagnosis.
Across the 25 organizations assessed, the difference between predicted and observed
hypertension prevalence was as high as 13.8 percentage points, and the percentage
of patients with an outpatient visit who did not have a documented BP measurement
during the observation period was as high as 15.9%. The identification of lower than
anticipated hypertension prevalence or BP screening rates allows organizations to
evaluate and refine systems of care to improve the diagnosis and management of hypertension
(
3
). This could include, as an initial step, reassessing patients who had a single in-office
BP ≥160/100 mm Hg or two readings on different days ≥140/90 mm Hg to establish, if
warranted, a documented diagnosis and to ensure provision of appropriate hypertension
treatment. This is a conservative approach, and recent guidelines (
4
) might suggest even lower thresholds. One report found that approximately one in
three patients who met the BP criteria alone and were able to be reassessed received
a diagnosis of hypertension (
5
).
This report reinforces the utility of using multiple data sources to identify patients
in potential need of chronic disease management and to estimate the prevalence of
chronic conditions. In addition, these findings indicate how the identification of
patients for inclusion in clinical registries or quality improvement measure reporting
†††
depend on the data types (i.e., medical billing data alone or in combination with
clinical data) used to detect the targeted conditions. Higher comorbidity and observed
hypertension prevalence were found when clinical data were included with billing data
for case ascertainment, particularly for obesity. Billing data are generated to initiate
payment for services rendered, and some conditions might not be prioritized for treatment
or billing because of patients’ competing health needs or limited reimbursement. Therefore,
use of billing data alone to describe the prevalence of hypertension and other chronic
conditions or to predict hypertension prevalence likely underrepresents the burden
(
6
–
8
). If organizations are unable to use all three data sources to describe their comorbidity
prevalence (in particular obesity prevalence), they might consider using the nonorganization-specific
comorbidity estimates provided in the Hypertension Prevalence Estimator Tool to predict
their hypertension prevalence. When the nonorganization specific comorbidity estimates
were applied, the predicted hypertension prevalence typically was closest to the observed
hypertension prevalence determined using all available billing and clinical data.
The findings in this report are subject to at least four limitations. First, the billing
and clinical definitions used align with national standards and guidelines, but variation
might exist in how the conditions are diagnosed and documented across organizations.
Furthermore, the data were not assessed to ensure appropriate coding or documentation.
Both of these factors could potentially lead to variation in disease prevalence estimates,
including the degree of prevalence underestimation, and indicate more differences
in clinical practice, documentation, and billing than in the actual health status
of the population. Second, organizations participating in this national learning collaborative
are considered to be high performing; therefore, the differences between predicted
and observed hypertension prevalence reported in this study are likely to underestimate
quality gaps in other organizations. Third, it was not possible to determine the actual
observed hypertension prevalence of this population. To do so would involve further
assessment of those patients who either met the clinical definition alone or did not
have a BP assessment during the observation period. Finally, new evidence suggests
that compared with standardized BP observation, BP readings taken in a clinical setting
overestimate systolic BP by an average of 6.4 to 11.8 mm Hg depending on the study
setting and independent of “white coat syndrome” or masked hypertension (
9
,
10
)
Improving management of hypertension in health care organizations is multifaceted,
requiring interventions across multiple systems and within diverse disciplines, including
those reviewed in the Guide to Community Preventive Services
§§§
and summarized by the Million Hearts initiative.
¶¶¶
The tool assessed in this report can be used to support the evaluation of the effectiveness
of these organizations in identifying hypertension. With recently released updated
hypertension guidelines (
4
) that increased the number of persons classified as having hypertension, there is
an urgent need for careful and thorough identification and treatment of people with
hypertension.
Summary
What is already known about this topic?
Approximately 11 million U.S. adults with a usual health care source have undiagnosed
hypertension. Identification, diagnosis, and treatment of hypertension are needed
to decrease the risk for an adverse cardiovascular event.
What is added by this report?
Using the Million Hearts Hypertension Prevalence Estimator Tool to calculate and compare
observed and predicted prevalences of hypertension among approximately 9 million U.S.
patients revealed that nearly one in eight patients with hypertension might not have
received a diagnosis.
What are the implications for public health practice?
The Hypertension Prevalence Estimator Tool might improve hypertension identification
within health care delivery organizations; using both billing and clinical data to
establish hypertension and comorbidity prevalence estimates are important to support
clinical quality improvement efforts.
Related collections
Most cited references8
- Record: found
- Abstract: found
- Article: not found
Measuring diagnoses: ICD code accuracy.
Kimberly O'Malley, Karon Cook, Matt D Price … (2005)
- Record: found
- Abstract: found
- Article: found
Accuracy of administrative databases in identifying patients with hypertension
Karen Tu, Norman RC Campbell, Zhong-Liang Chen … (2007)